Margaret tucked £5,000 into a current account in 2000 and barely touched it. The balance still reads £5,000, and she feels it is safe. Yet the link between inflation and savings tells a less comfortable story: measured against UK consumer prices, her money now buys roughly what £2,530 bought when she put it there.
Quick answer: The link between inflation and savings is simple to measure: multiply any sum by the later CPI index divided by the earlier one to compare buying power. On ONS figures, £1,000 kept as cash since 2000 now buys about what £506 did then, and prices rose around 24% between 2021 and 2025.
Nothing was stolen and no fee was charged. Prices simply crept up year after year while her balance stood still. Using the official consumer prices index published by the Office for National Statistics, the sections below put real numbers on that slow leak and show how to check whether your own savings are keeping up.
In This Guide
What Is the CPI Index and How Do You Read It?
The ONS turns the price of a huge basket of everyday goods and services into one index number, set so that 2015 equals 100. The ONS tracks a huge basket of everyday goods and services and turns the combined price into one index number. Its CPI index series D7BT is set so that 2015 equals 100. If the index for a later period reads 143.6, the basket costs 43.6% more than it did on average in 2015.
Comparing two years only needs one division. Take the index for the later year, divide it by the index for the earlier year, and multiply your sum of money by the result. The annual averages used here are 72.7 for 2000, 111.6 for 2021, 138.4 for 2025 and 143.6 for the latest monthly reading, August 2026. For Margaret, 143.6 divided by 72.7 is about 1.975, so prices have very nearly doubled while her balance has not moved.
One caution: an annual average and a single month are not quite the same thing, so any comparison that ends in August 2026 is a close estimate rather than an exact figure. For planning a household budget, that gap is small enough to ignore.
What £1,000 from past years needs to be today
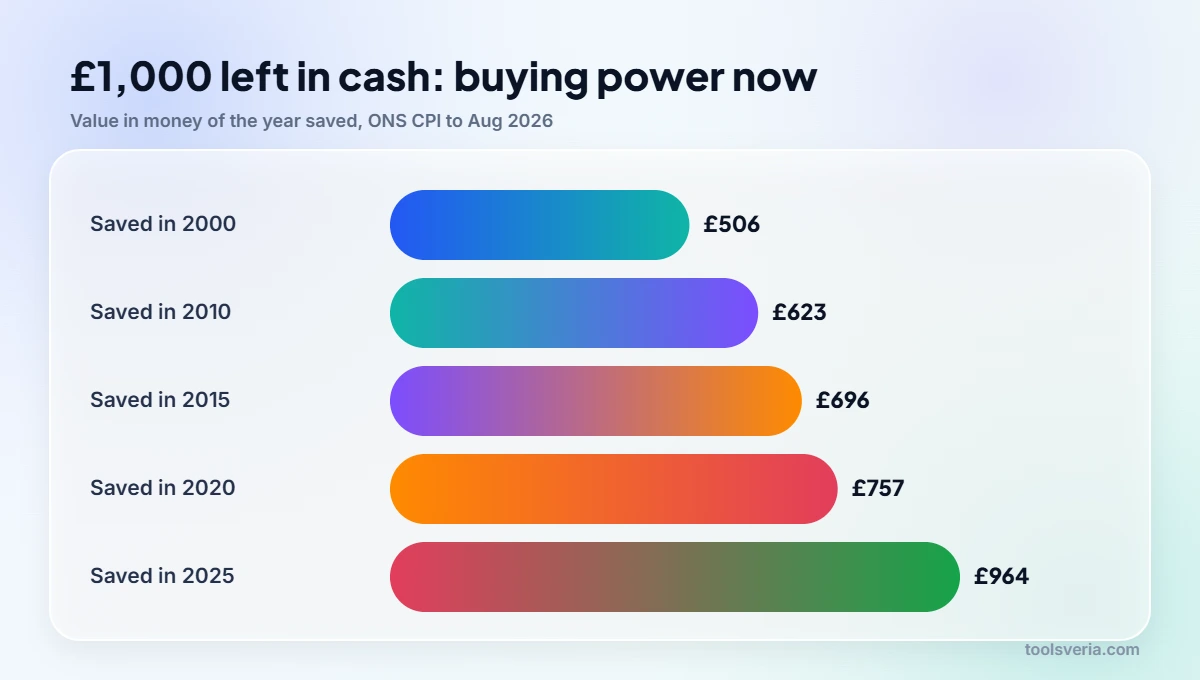
The table answers a simple question for several starting points: how much would you need in August 2026 to buy what £1,000 bought on average in that year? The last column flips it round and shows what an untouched £1,000 is worth now in the money of that earlier year.
| Year saved | CPI annual average | Needed in Aug 2026 to match £1,000 | Old buying power of £1,000 left in cash |
|---|---|---|---|
| 2000 | 72.7 | £1,975.24 | £506.27 |
| 2010 | 89.4 | £1,606.26 | £622.56 |
| 2015 | 100.0 | £1,436.00 | £696.38 |
| 2020 | 108.7 | £1,321.07 | £756.96 |
| 2022 | 121.7 | £1,179.95 | £847.49 |
| 2025 | 138.4 | £1,037.57 | £963.79 |
Even cash set aside as recently as 2020 has lost close to a quarter of its buying power. A grandparent who gave a child £1,000 that year and saw it banked with no interest has effectively handed over about £757 in today’s terms.
How Much Did Prices Rise Between 2021 and 2025?
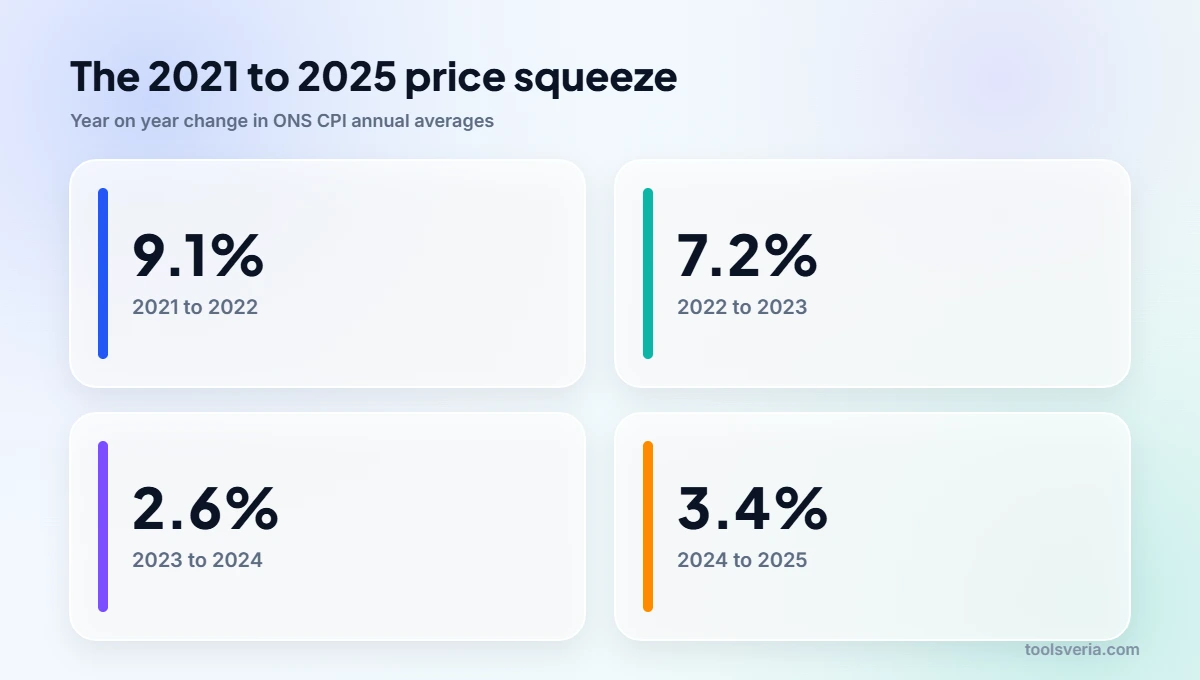
Prices rose about 9.1% from 2021 to 2022, 7.2% into 2023, 2.6% into 2024 and 3.4% into 2025, so the 2025 price level sits 24% above 2021. Long stretches hide how uneven price rises can be. Working year by year from the annual averages, prices rose about 9.1% from 2021 to 2022, 7.2% from 2022 to 2023, 2.6% into 2024 and 3.4% into 2025. Stack those together and the 2025 price level sits 24% above 2021.
Callum had £10,000 in an emergency pot at the start of that period. To have the same buying power by 2025, he needed £12,401.43. Had his pot earned nothing, his £10,000 would buy only about £8,064 of 2021 goods. Rising rent, food and fuel bills made the loss feel sharper, because he was also dipping into the pot more often.
These yearly figures come from annual averages, which smooth out the peaks. Headline monthly rates reported on the news can look higher or lower depending on the month, so do not be surprised if your memory of a figure differs a little from the numbers here.
How Much Must £20,000 Grow to Keep Pace With Prices?
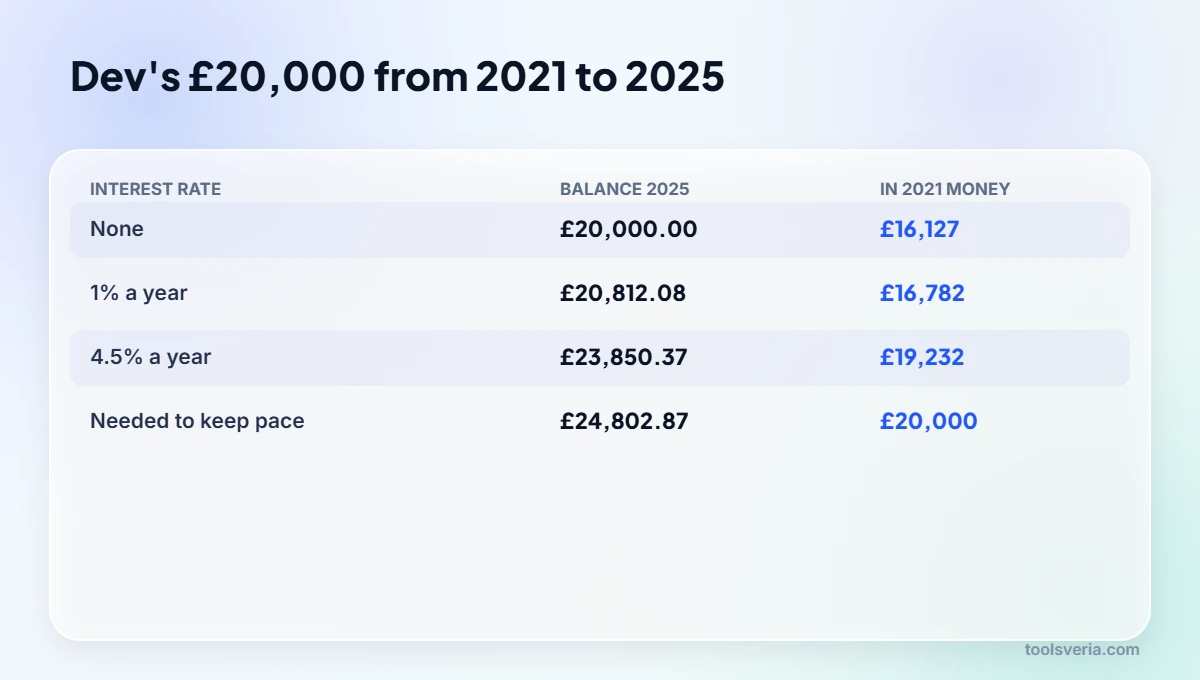
To protect its buying power from 2021 until 2025, a £20,000 savings balance needed to reach £24,802.87. Dev put £20,000 into savings in 2021. To protect his buying power until 2025, his balance needed to reach £24,802.87. Here is how three different outcomes compare, assuming interest is added once a year and left in the account:
- No interest: £20,000, worth about £16,127 in 2021 money.
- 1% a year: £20,812.08, worth about £16,782 in 2021 money.
- 4.5% a year: £23,850.37, worth about £19,232 in 2021 money.
Even a steady 4.5% left Dev short of the £24,802.87 target, because prices raced ahead fastest in the early years. Testing your own rate is straightforward: put your balance and rate into our savings interest calculator, then compare the end figure with the inflation adjusted target. If you want to see interest building on interest over a longer horizon, the compound interest calculator projects that growth year by year.
Tax can widen the gap between inflation and savings returns. Interest above your personal savings allowance is taxable, so the rate that really matters is the one left after tax. The Bank of England’s explanation of its inflation target is useful context here, since it aims to hold CPI inflation at 2% over time, and that figure is a sensible minimum for an after tax savings rate.
Practical habits for keeping cash in step with prices
Even with inflation and savings pulling in opposite directions, cash still has a clear job: an emergency fund needs to be instantly available and stable in pounds. The trick is to stop treating all of it the same. A few habits help:
- Check your account’s rate each January against the most recent CPI figure, then move money if it trails.
- Keep the emergency pot sized to need, perhaps three to six months of costs, rather than letting surplus sit idle at a low rate.
- Revalue savings goals every year. Margaret’s original target of £5,000 for a new kitchen would now need nearly £9,900 to buy the same thing.
- When a price jumps, express it as a percentage. A bill rising from £80 to £86 is a 7.5% increase, which our percentage difference calculator works out instantly, and you can set that alongside your savings rate.
Key points
- Multiply any sum by the later CPI index divided by the earlier one to compare buying power.
- £1,000 kept as cash since 2000 now buys about what £506 did then.
- Prices rose around 24% between 2021 and 2025 on ONS annual averages.
- Your after tax interest rate needs to match inflation just to stand still.
Frequently Asked Questions
My parents saved £1,000 for me in 2010. What is that worth now?
Based on CPI, you would need about £1,606 in August 2026 to match it. If the money sat in cash with no interest, its buying power has fallen to around £623 in 2010 terms.
My account pays 3% and prices rose 3.4% last year. Am I losing money?
In real terms, yes, slightly. Your balance grows in pounds, but each pound buys a little less, and tax on the interest would widen the shortfall further.
Why use CPI rather than my own shopping bills?
CPI is the official measure and covers a broad basket, so it gives a consistent yardstick. Your own costs may rise faster or slower, especially if rent or energy makes up a large share of your spending.
Is a 2025 to August 2026 comparison exact?
It is a close estimate, because 138.4 is a full year average and 143.6 is one month. The suggested rise of about 3.8% is fine for planning but not an official annual rate.
Margaret has since moved most of her £5,000 into an account that pays a competitive rate, keeping a small sum on hand for emergencies. Look up the year your own savings began, run the comparison and decide whether your cash is resting or quietly shrinking.