A CAGR calculator that also finds future values and years needed, with real growth after inflation.
| Year | Value | Growth that year |
|---|
CAGR smooths growth into one steady yearly rate. It ignores the ups and downs along the way and any money added or withdrawn, so it is a summary, not a forecast or financial advice.
This CAGR calculator works out the compound annual growth rate of an investment, a business or any figure that grew between two dates, in pounds, dollars or euros. It can also run the sum backwards to find a future value or the years needed to reach a target, and it shows the compound annual growth rate formula in action with a year by year table and a real rate after inflation.
Quick answer: A CAGR calculator divides the end value by the start value, raises the result to the power of 1 divided by the number of years, then subtracts 1. So £10,000 growing to £16,000 over 5 years is (1.6)^(0.2) − 1 = 9.86% a year, even though total growth was 60%.

In This Guide
What Is CAGR?
CAGR, short for compound annual growth rate, is the single steady yearly rate that would take a starting value to an ending value over a given number of years. It answers the question "what did this grow by each year, on average, once compounding is included?"
The formula is CAGR = (end value ÷ start value)^(1 ÷ years) − 1. Because each year's growth builds on the last, CAGR is always lower than total growth divided by the number of years when growth is positive. Mathematically it is the geometric mean of the yearly growth factors minus one, which is what makes it fair across years of uneven growth.
How to Use the CAGR Calculator
Step 1: Choose What to Find and Your Currency
In the CAGR calculator, pick CAGR to measure past growth, End value to project a figure forward at a chosen rate, or Years needed to see how long a target takes. Then choose GBP, USD or EUR; the currency only changes the symbol.
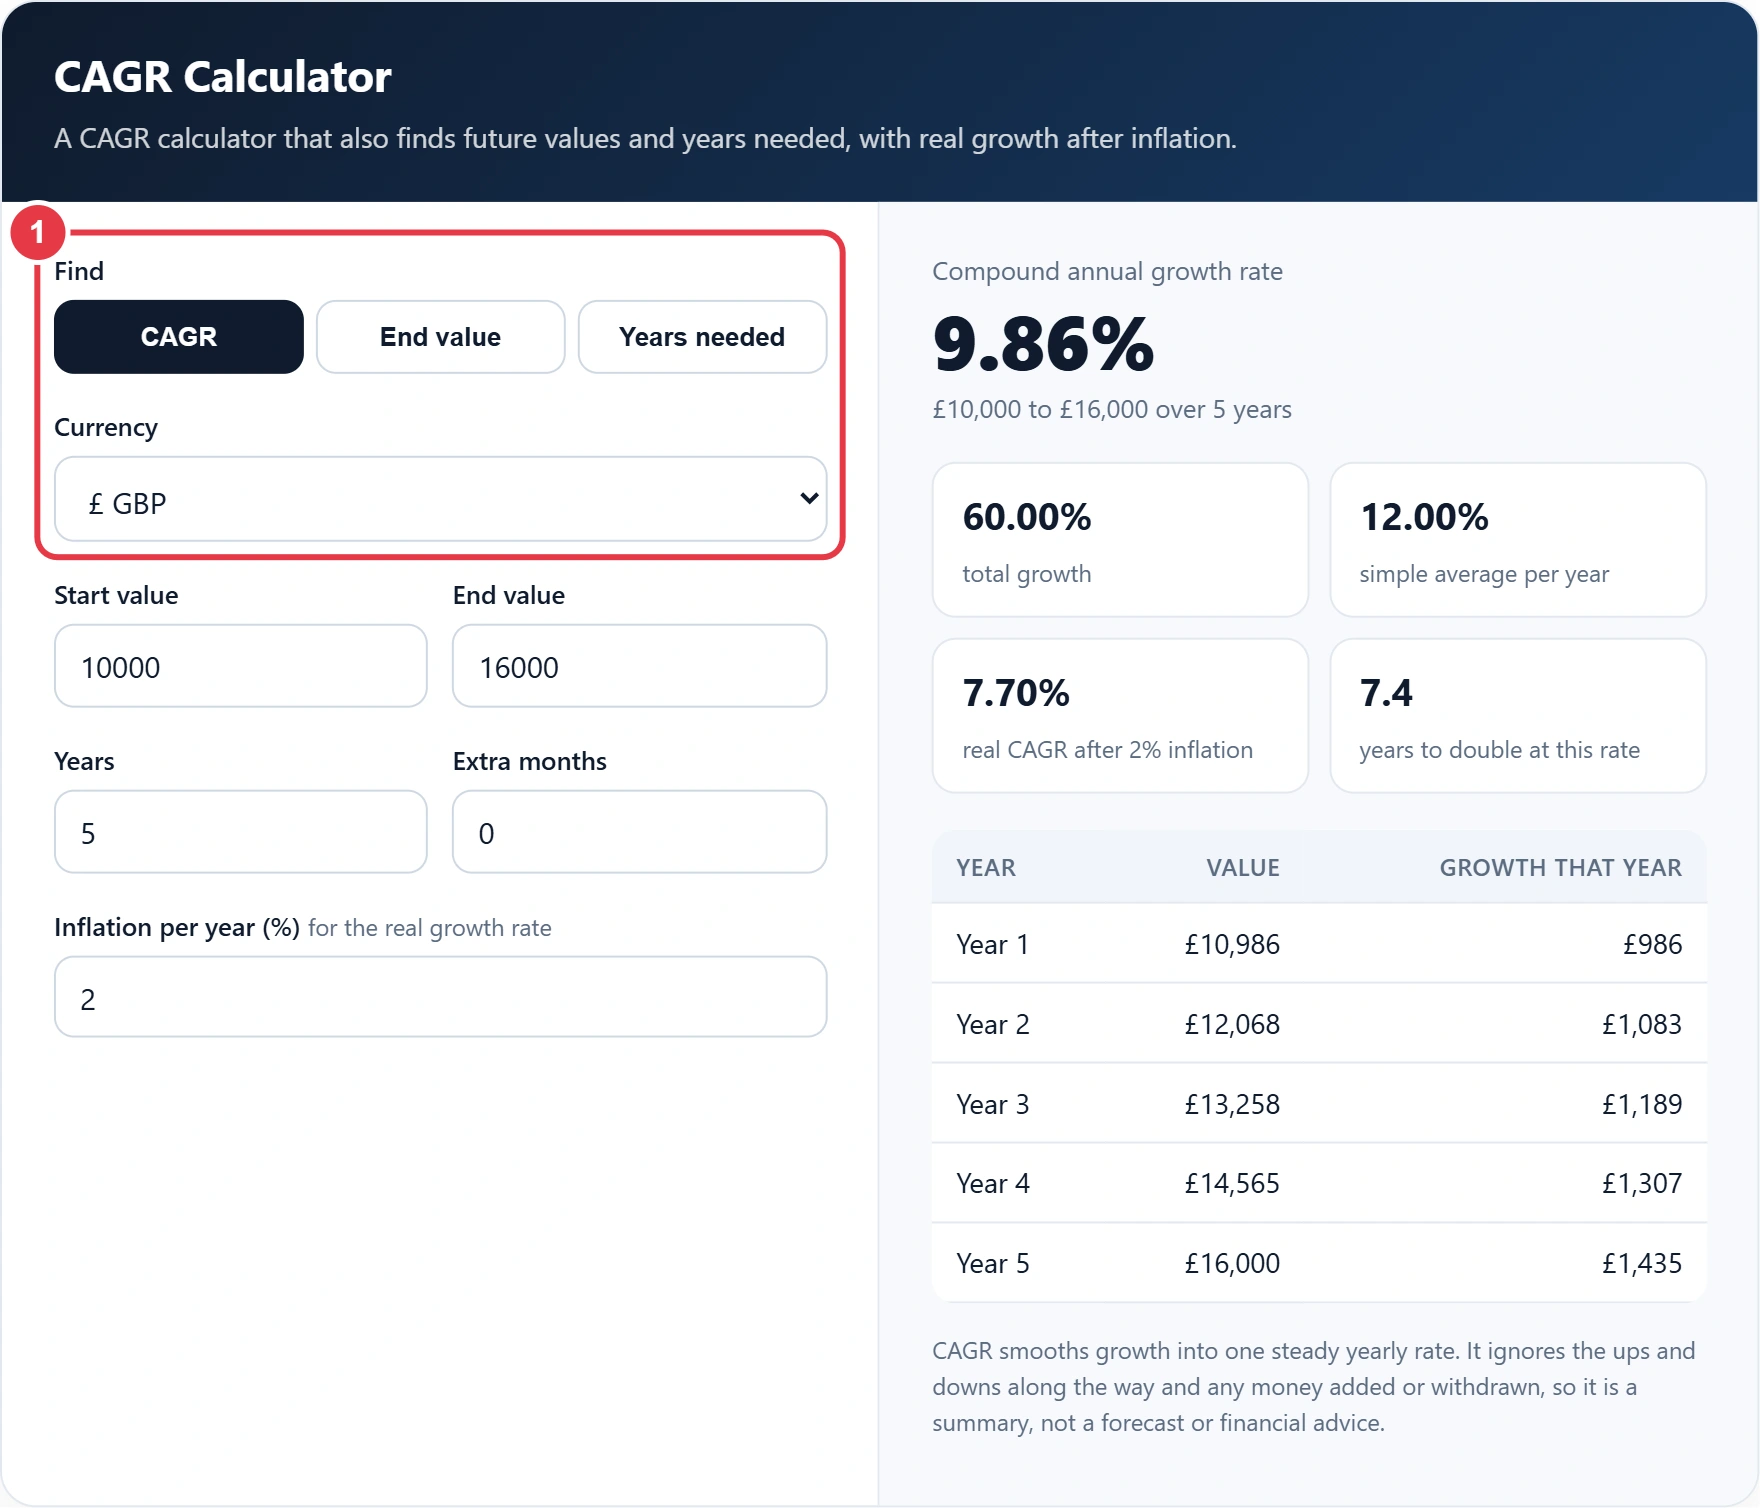
Step 2: Enter the Start and End Values
Type the value at the beginning and at the end of the period. These can be a portfolio, a house price, company revenue, website visitors or a population. The start value must be above zero.

Step 3: Set the Period and Inflation
Enter whole years and any extra months, so 3 years and 6 months counts as 3.5 years. Add an inflation rate to see real growth in today's money; the Bank of England targets 2% CPI inflation, which is the default.

Step 4: Read the Results
The compound annual growth rate calculator then shows the CAGR, total growth, the simple average for comparison, the real CAGR and how many years the value takes to double. The table shows the smoothed value at the end of each year, which makes this CAGR calculator handy for charts and reports.

How Do You Calculate CAGR by Hand?
To calculate CAGR by hand, divide the end value by the start value, raise that to the power of one over the number of years, and subtract one. On a phone calculator, use the x^y key with 1 ÷ years as the power.
Worked example: Hannah put £8,000 into a fund that was worth £13,500 six years later. 13,500 ÷ 8,000 = 1.6875, and 1.6875^(1 ÷ 6) = 1.0911, so her CAGR is 9.11%. Total growth was 68.75%, a simple average of 11.46% a year, which overstates her real yearly gain. With 2% inflation her real annual growth rate is about 6.97%.
For money you keep adding to, such as monthly savings, CAGR on the account balance is misleading because new deposits look like growth. In that case the compound interest calculator models regular contributions properly, and a money weighted return is the better measure.
How Much Does a Value Grow at Different CAGRs?
At a 7% CAGR a value roughly doubles in 10 years, and at 10% it grows more than six times over 20 years. The table shows the growth multiple for common rates, so £1 becomes the amount shown.
| CAGR | After 5 years | After 10 years | After 20 years | Years to double |
|---|---|---|---|---|
| 3% | 1.16× | 1.34× | 1.81× | 23.4 |
| 5% | 1.28× | 1.63× | 2.65× | 14.2 |
| 7% | 1.40× | 1.97× | 3.87× | 10.2 |
| 10% | 1.61× | 2.59× | 6.73× | 7.3 |
The last column uses the exact doubling time, log 2 ÷ log(1 + rate). The quick shortcut of 72 divided by the rate, explained on the rule of 72 calculator, gives almost the same answers for rates between 5% and 10%.
Why Is CAGR Different From the Average Annual Return?
CAGR is different because it compounds, while a simple average just adds the yearly returns and divides. If an investment rises 50% one year and falls 50% the next, the average return is 0%, but £100 becomes £150 and then £75, a CAGR of −13.4% a year.
That is why fund factsheets quote annualised figures. Remember that CAGR hides volatility: two investments with the same CAGR can have very different paths. It also ignores fees and tax unless your end value is already after them, and past growth is no guide to the future.
Key CAGR Terms Explained
These terms explain the maths behind every CAGR calculator result on this page, from geometric averages to real growth after inflation.
- Compound annual growth rate
- The steady yearly rate that turns a start value into an end value over a set number of years, found as (end ÷ start)^(1 ÷ years) − 1. £10,000 to £16,000 over 5 years is 9.86%.
- Geometric mean
- An average found by multiplying values together and taking the matching root. CAGR is the geometric mean of the yearly growth factors minus one, which is why it is lower than a simple average when results vary.
- Real growth rate
- Growth after removing inflation, found as (1 + CAGR) ÷ (1 + inflation) − 1. A 9.11% CAGR with 2% inflation gives about 6.97%, the increase in buying power each year.
- Doubling time
- The number of years a value takes to double at a fixed growth rate, equal to log 2 ÷ log(1 + rate). At 7% it is about 10.2 years and at 10% about 7.3 years.
- Simple average return
- Total growth divided by the number of years, ignoring compounding. It overstates yearly growth whenever returns compound: 68.75% total growth over 6 years averages 11.46% a year, while the true CAGR for the same period is only 9.11%.
</>Embed this calculator on your website
Add the free CAGR Calculator to your own site or blog. Copy the code below and paste it into an HTML block. It resizes itself and works on phones.
How we checked this tool: the Tools Veria Editorial Team built this tool by hand, checked it against the official rules or published standards where they apply, and tested it against worked examples. Results are estimates for planning, not personal financial or tax advice. Read our editorial policy and disclaimer, or report an error.
Frequently Asked Questions
What is a good CAGR?
It depends on what you measure and the risk taken. Compare it with inflation (the Bank of England target is 2%), with cash savings rates and with a relevant index over the same years. A CAGR above inflation means real growth.
Can CAGR be negative?
Yes. If the end value is lower than the start value, CAGR is negative. For example, £10,000 falling to £8,000 over 3 years is a CAGR of −7.17% a year. If the end value is zero, CAGR is −100%.
How do I calculate CAGR in Excel?
Use =(End/Start)^(1/Years)-1 and format the cell as a percentage. Excel's RRI function gives the same answer: =RRI(Years, Start, End). For 10,000 to 16,000 over 5 years both return 9.86%.
Can I use CAGR for less than one year?
You can, but the result is annualised and can look extreme. A 10% gain over 6 months becomes a CAGR of 21% because it assumes the same pace continues for a full year, so treat short periods with care.
What is the difference between CAGR and ROI?
ROI is total gain as a percentage of the amount invested, with no time element. CAGR spreads that gain across the years. A 60% ROI over 5 years is a CAGR of 9.86%, while the same ROI over 10 years is only 4.81%.
Does CAGR include dividends?
Only if your end value includes them. Using a share price alone ignores dividends, so add reinvested dividends to the end value to get the total return CAGR, which is usually higher than price growth.