Price to earnings, earnings yield, PEG and a fair price at your chosen multiple.
Use the same earnings basis throughout: trailing (last 12 months) or forward (forecast). Growth and target P/E are your own assumptions, not market data.
Two shares can both cost £12.50 and still be wildly different value. This P/E ratio calculator compares the price with the profit behind it, then adds the earnings yield, the PEG ratio and the price a share would trade at on a multiple you think is fair. It works from per share figures or from a company's total market value and net profit, whichever you have to hand.
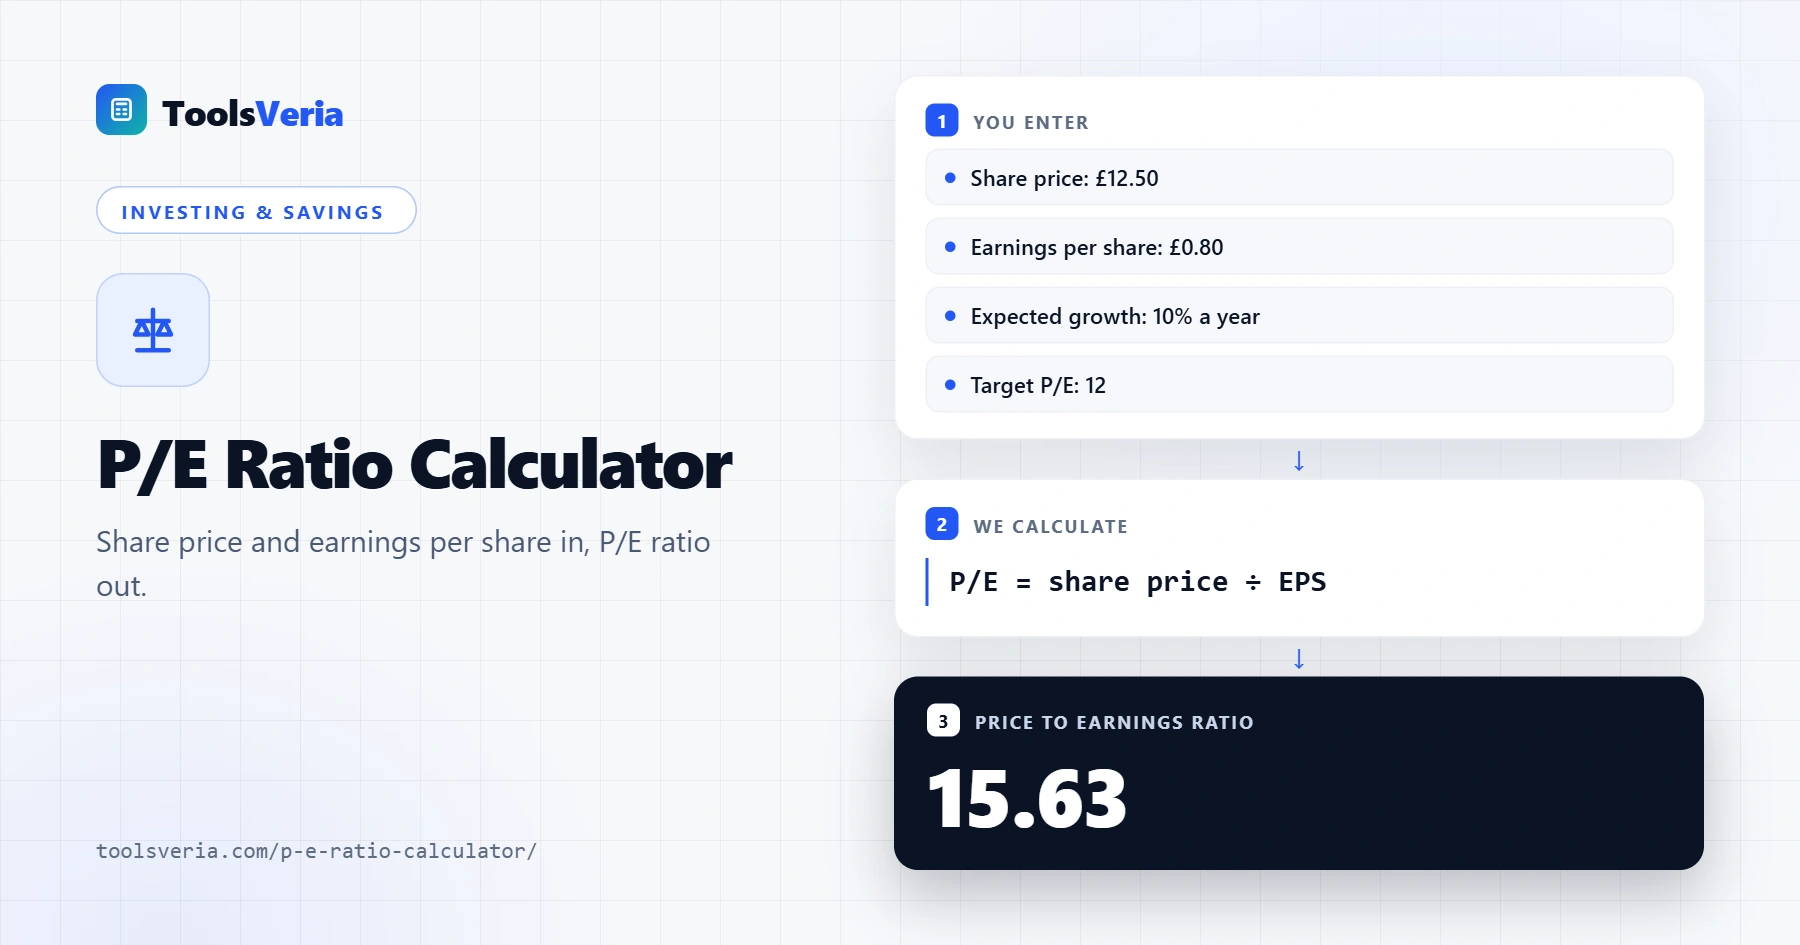
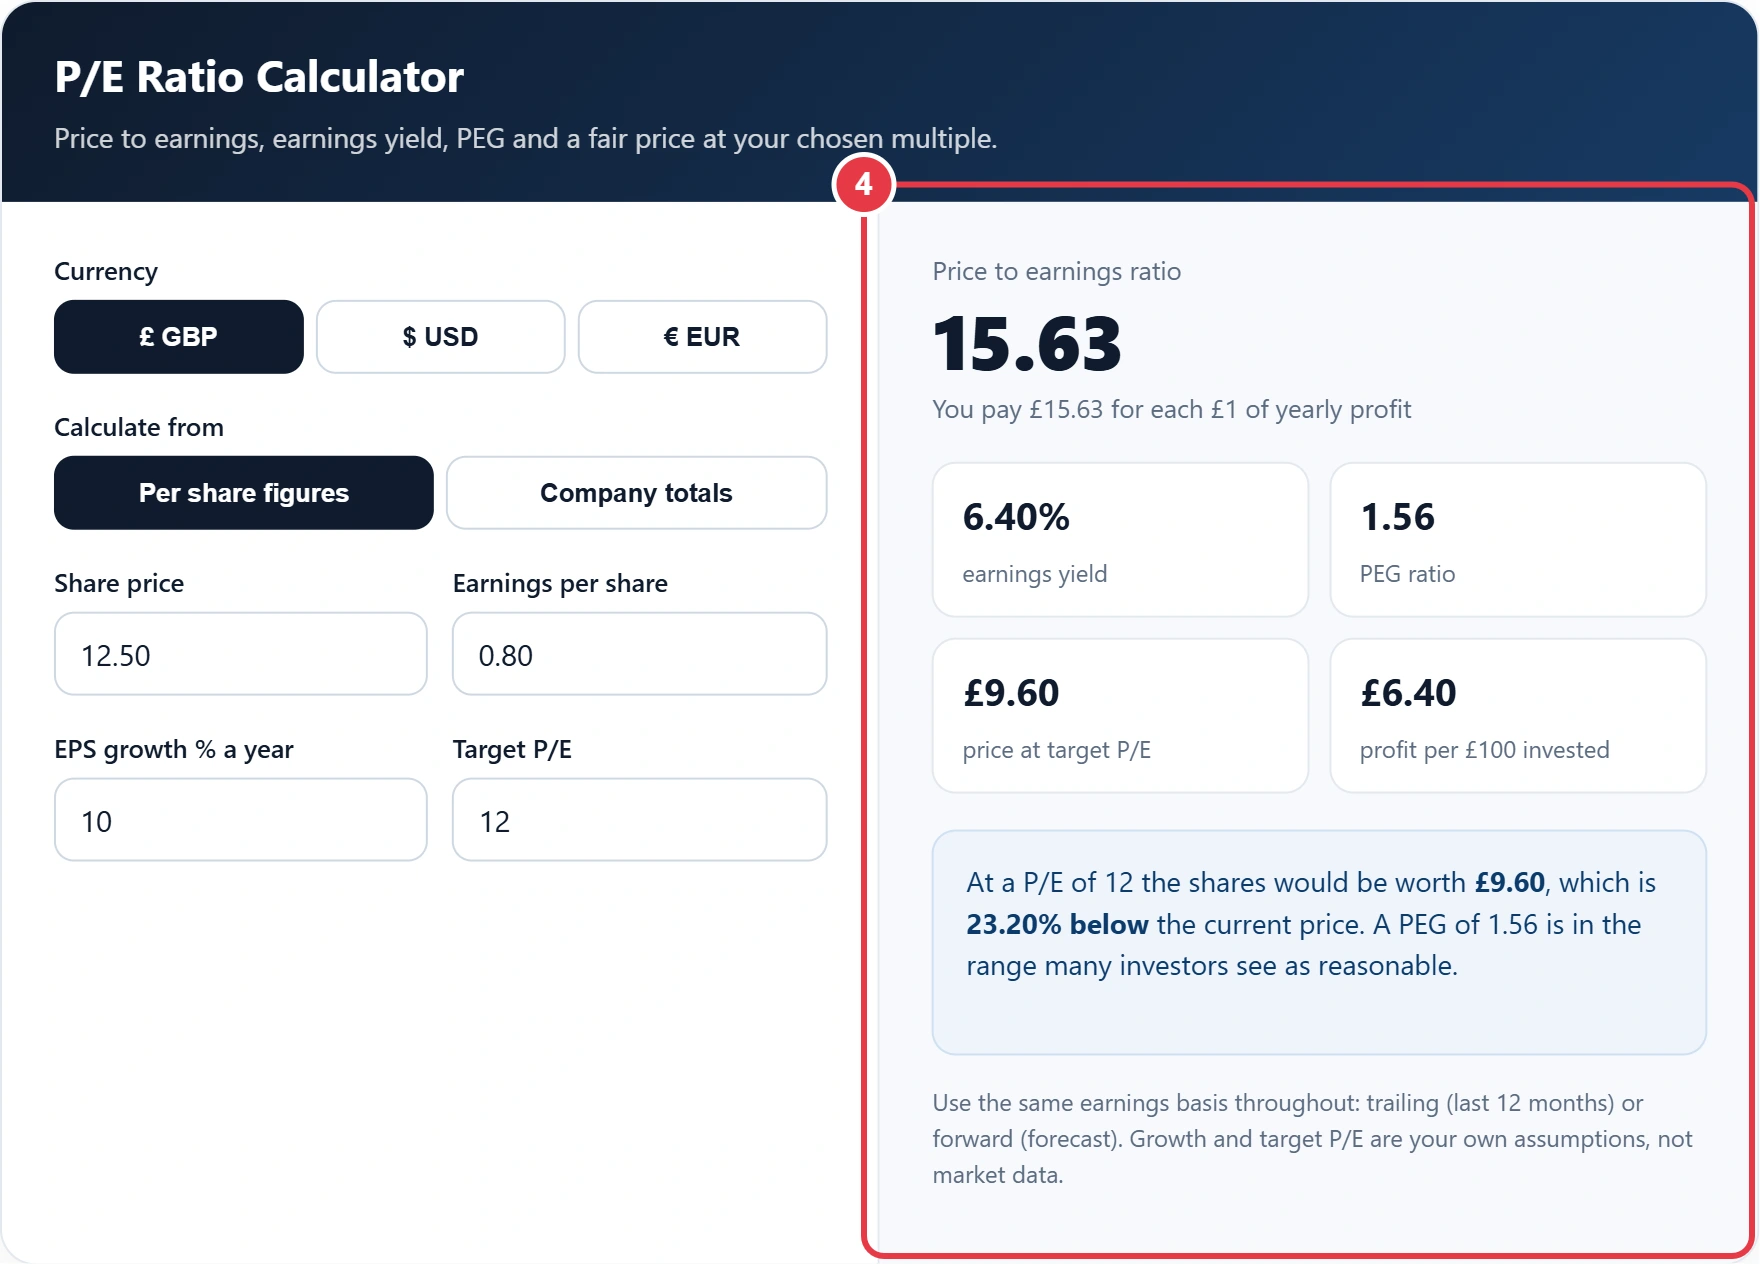
Quick answer: A P/E ratio calculator divides the share price by earnings per share. A share priced at £12.50 that earned 80p per share has a P/E of 15.63 and an earnings yield of 6.4%. With 10% expected yearly profit growth, the PEG ratio is 1.56, and at a fair P/E of 12 the implied price is £9.60.
In This Guide
What Is the P/E Ratio?
The price to earnings ratio tells you how many years of current profit you are paying for when you buy a share. It is calculated as share price ÷ earnings per share, or market value ÷ net profit for the whole company. Flip it over and you get the earnings yield, which is handy for comparing a share with the interest on cash or a bond.
Say Hannah is looking at an engineering firm priced at £12.50 that earned 80p per share last year. Its P/E is 12.50 ÷ 0.80 = 15.63, so she is paying about £15.63 for every £1 of annual profit, an earnings yield of 6.4%. If analysts expect profits to grow 10% a year, the PEG ratio is 15.63 ÷ 10 = 1.56. And if Hannah believes 12 times earnings is fair for this sector, the implied price is 12 × £0.80 = £9.60, about 23% below the market.
How to Use the P/E Ratio Calculator
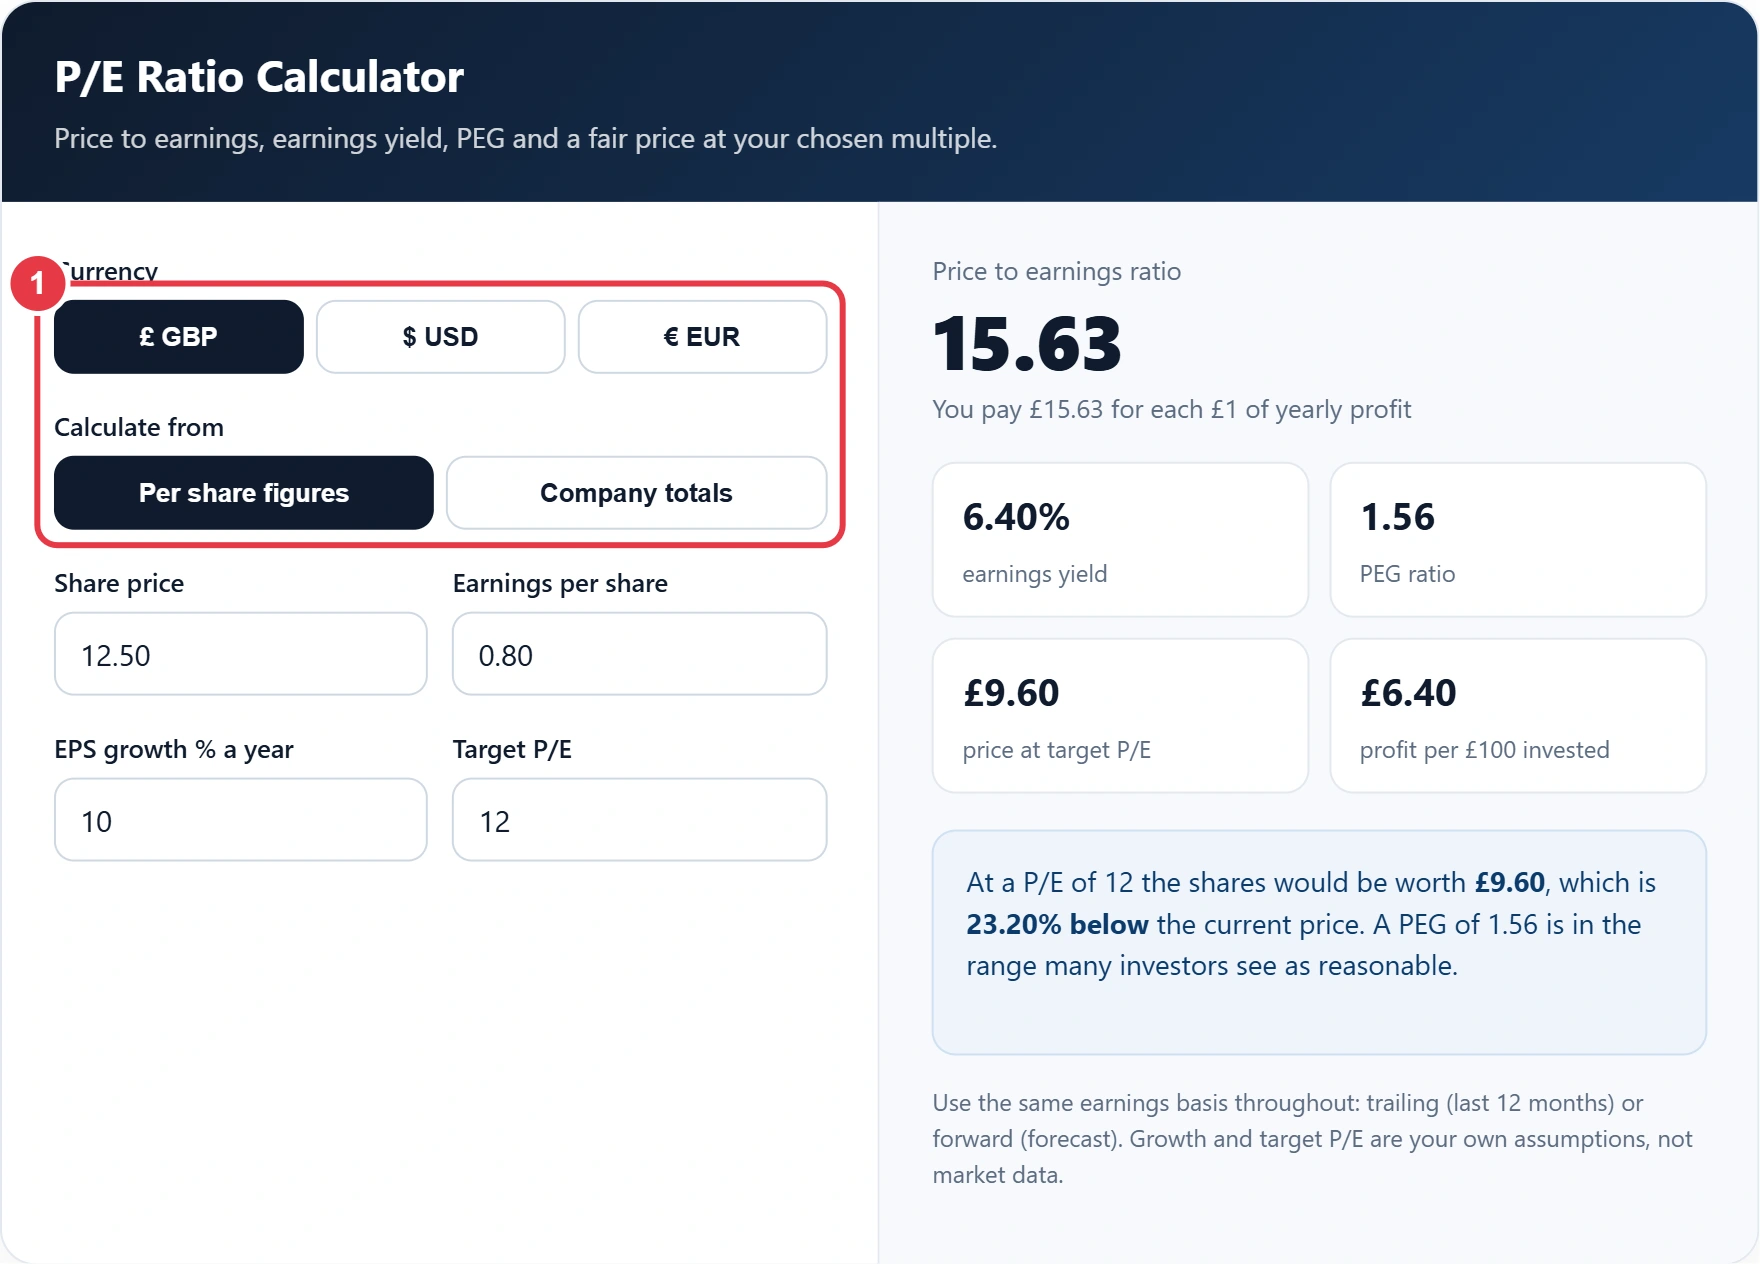
Step 1: Choose Your Currency and Input Type
Select pounds, dollars or euros. Use per share figures if you have the price and EPS, or company totals if an annual report gives you net profit and you know the market value.
Step 2: Enter Price and Earnings
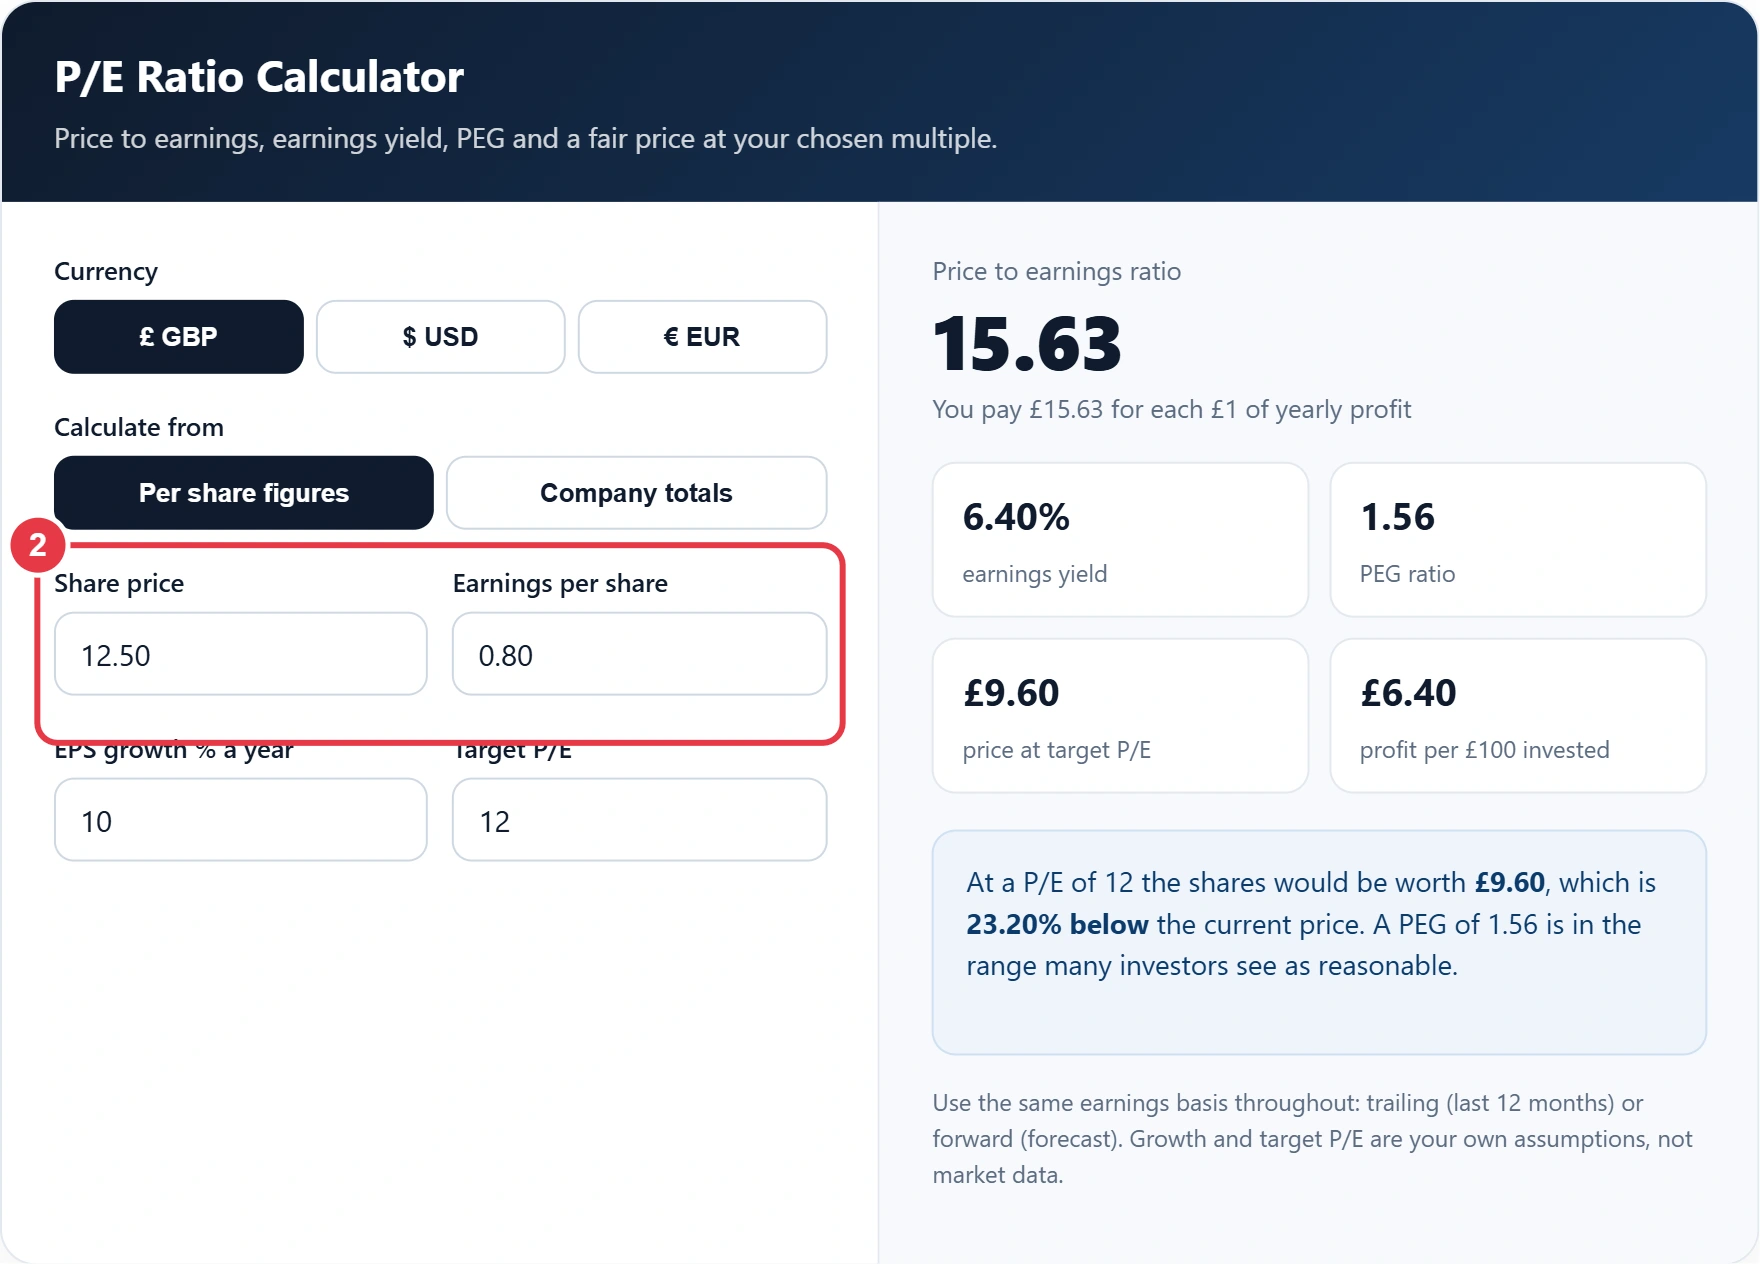
Type the share price and earnings per share, both in pounds rather than pence. The earnings per share figure appears in every set of results, often in basic and diluted versions, and the diluted number is the more cautious choice.
Step 3: Add Growth and a Target P/E
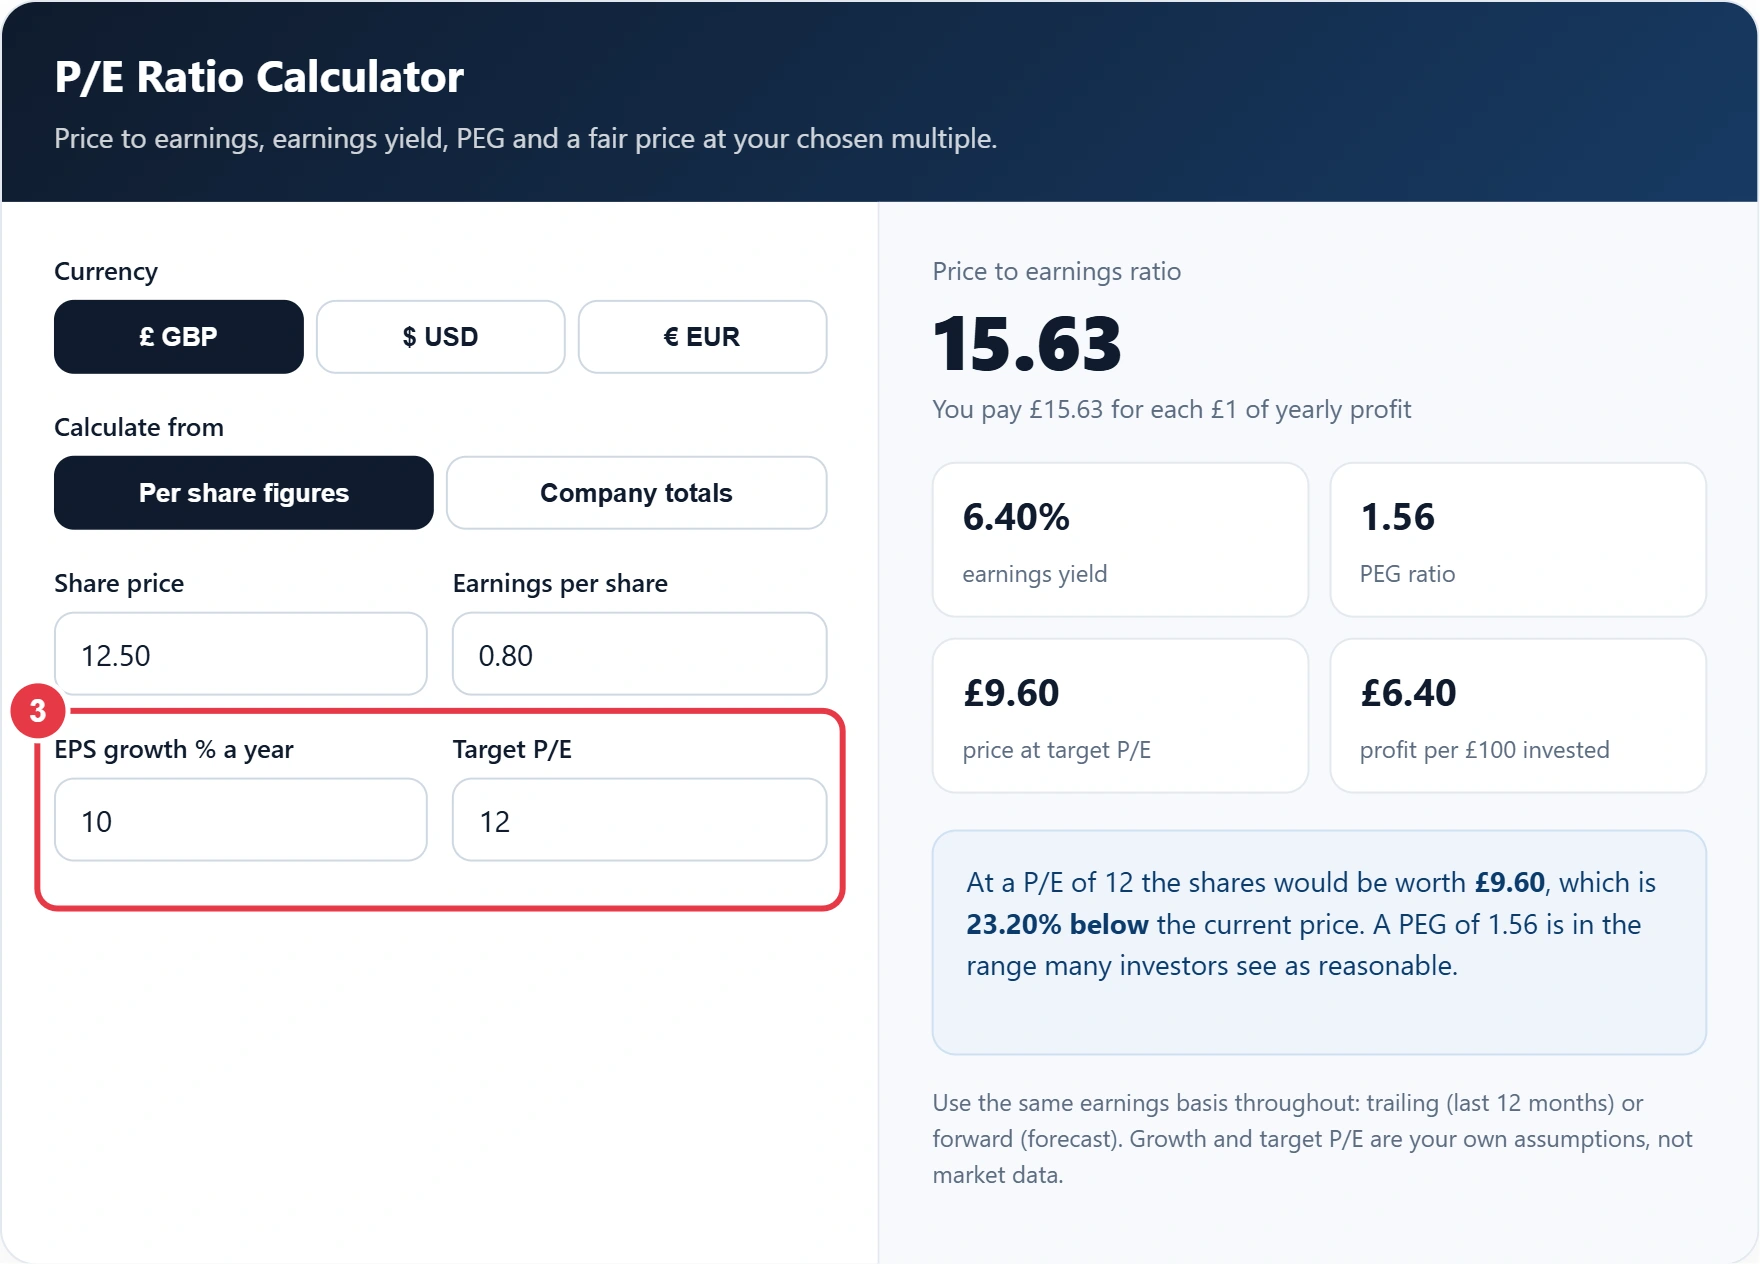
Both fields are optional assumptions. Growth feeds the PEG ratio, and the target P/E gives a price you can compare with today's. To check what a growth rate does to earnings over several years, the compound interest calculator applies the same yearly compounding to any starting figure.
Step 4: Read Your Results
The panel shows the P/E, the earnings yield, the PEG ratio and the implied price or market value. If earnings are zero or negative, the calculator tells you the ratio has no meaning rather than showing a misleading number.
How to Interpret a P/E
| P/E | Earnings yield | What it often signals |
|---|---|---|
| 8 | 12.5% | Low expectations, a cyclical business or real trouble |
| 15 | 6.7% | Steady, middle of the road profits |
| 25 | 4.0% | Investors expect strong growth |
| 50 | 2.0% | Price depends heavily on future profits arriving |
A P/E is only useful next to something else: the same company's history, its direct rivals, or the wider market. A bank and a software firm will never share a "normal" figure, and the ratio calculator can help when you want to line up other company figures in the same way. The FCA InvestSmart guidance is worth reading too, because a cheap looking P/E never removes the risk of losing money on a single share.
Key P/E Ratio Terms Explained
These valuation terms explain each output of the P/E ratio calculator, helping you compare shares fairly and avoid reading too much into a single multiple.
- Earnings per share
- A company's net profit attributable to ordinary shareholders divided by the number of shares in issue. It is the denominator of the price to earnings ratio, so the earnings basis you choose directly changes the result.
- Earnings yield
- Earnings per share divided by the share price, expressed as a percentage, which is the price to earnings ratio turned upside down. It allows a share's profit return to be compared with interest rates on cash or bond yields.
- PEG ratio
- The price to earnings ratio divided by the expected annual growth rate of earnings per share. It adjusts a multiple for growth, so a high ratio can look more reasonable if profits are forecast to rise quickly.
- Trailing and forward P/E
- Two versions of the ratio based on different profits: trailing uses earnings reported over the past year, while forward uses analysts' forecasts. Mixing them in one comparison gives misleading results.
- Diluted earnings per share
- Earnings per share recalculated as if all options, convertible bonds and similar instruments had become ordinary shares. It is lower than or equal to the basic figure, making it the more conservative measure.
- Market capitalisation
- The total stock market value of a company, equal to the share price multiplied by the number of shares in issue. Dividing it by annual net profit gives the same multiple as the per share calculation.
</>Embed this calculator on your website
Add the free P/E Ratio Calculator to your own site or blog. Copy the code below and paste it into an HTML block. It resizes itself and works on phones.
How we checked this tool: the Tools Veria Editorial Team built this tool by hand, checked it against the official rules or published standards where they apply, and tested it against worked examples. Results are estimates for planning, not personal financial or tax advice. Read our editorial policy and disclaimer, or report an error.
Frequently Asked Questions
What is a good P/E ratio?
There is no single good number. Compare the P/E with the company's own history and with close rivals in the same sector, since banks, utilities and tech firms trade on very different multiples.
What is the difference between trailing and forward P/E?
Trailing P/E uses the last 12 months of actual earnings. Forward P/E uses analysts' forecasts for the next year, so it depends on those forecasts being right.
Can a P/E ratio be negative?
If a company makes a loss, dividing by negative earnings gives a figure with no useful meaning. Most data sites show it as not applicable instead.
What is the PEG ratio?
PEG divides the P/E by the expected yearly growth rate of earnings in percent. A PEG near 1 is often read as fair, though it relies on a growth forecast.
What is earnings yield?
It is earnings per share divided by the share price, shown as a percentage. A P/E of 20 equals an earnings yield of 5%.
Should I enter the share price in pence?
No. Enter the price and EPS in the same unit, ideally pounds. A 1,250p share with 80p of EPS goes in as 12.50 and 0.80.