A two proportion z test on your control and variant, with a plain English verdict and a sample size planner.
| Confidence interval for B minus A | 0 |
| Sample size needed per variant | 0 |
Pooled two proportion z test, two sided. The interval uses the unpooled standard error. Sample size uses the standard normal approximation for comparing two proportions. Decide your sample size before the test and avoid stopping early when a result looks good.
You changed a button, a headline or a price, and version B converted a little better. Is it a genuine improvement or just a lucky week? This A/B testing significance calculator runs a two proportion z test on your results, gives you a p value, the relative uplift and a plain English verdict, and works out how many visitors a reliable A/B test would need in each group. Everything happens in your browser and nothing is stored.
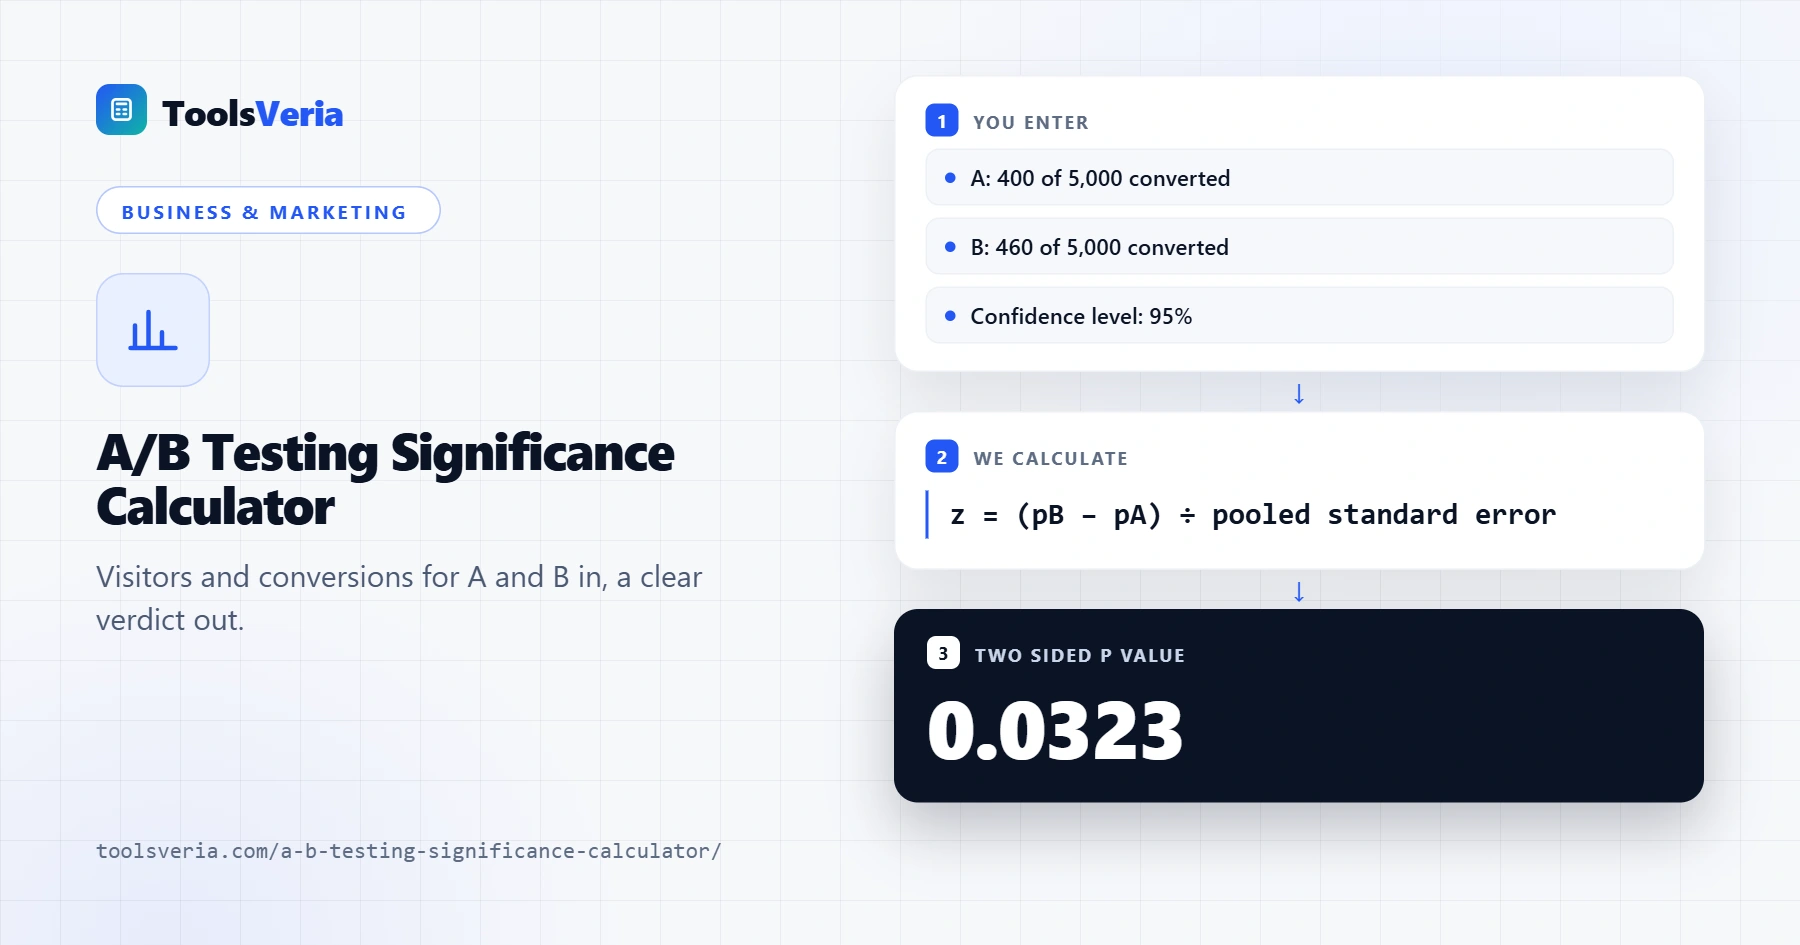
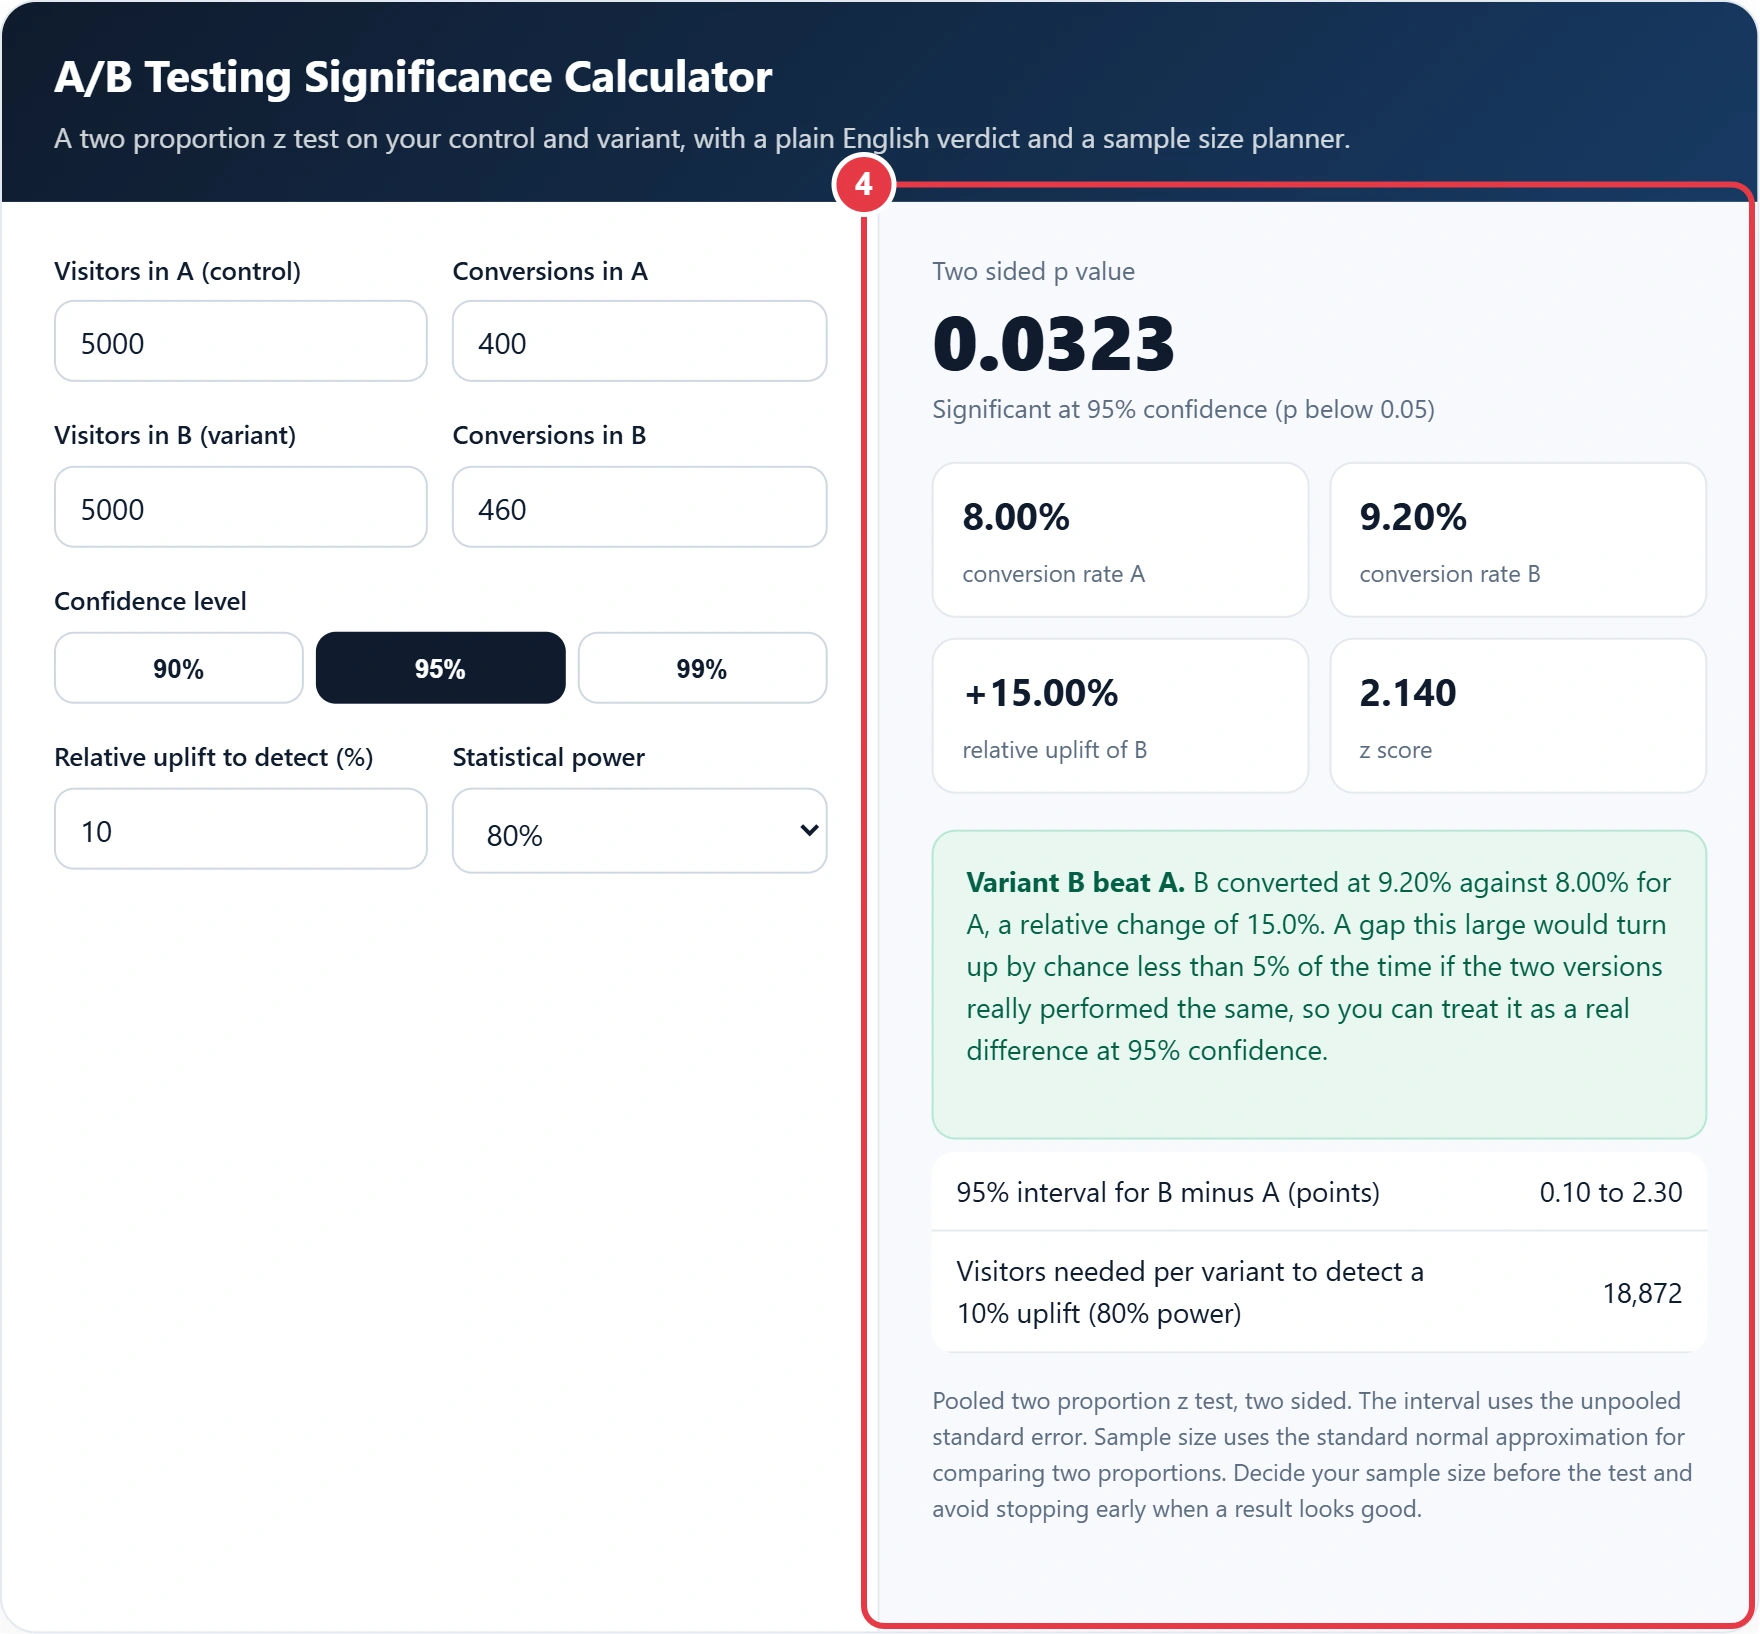
Quick answer: An A/B testing significance calculator runs a two proportion z test on the visitors and conversions for each version. If the two sided p value falls below 0.05, the result is significant at 95% confidence. 400 sales from 5,000 visitors against 460 from 5,000 gives a p value of 0.0323, significant at 95% but not at 99%.
In This Guide
What Is Statistical Significance in an A/B Test?
Any two groups of visitors will convert at slightly different rates even if you show them identical pages. Significance testing asks how surprising your observed gap would be if A and B truly performed the same. The calculator pools both groups to estimate a shared rate, works out the standard error, and divides the difference by it to get a z score: z = (pB minus pA) ÷ √(p(1 minus p)(1/nA + 1/nB)).
The two sided p value is the chance of a z score at least that far from zero, in either direction, when there is no real difference. If it falls below 0.10, 0.05 or 0.01, the result is significant at 90%, 95% or 99% confidence respectively. A p value is not the probability that B is better; it measures how unusual your data would be under no effect.
How to Use the A/B Testing Significance Calculator
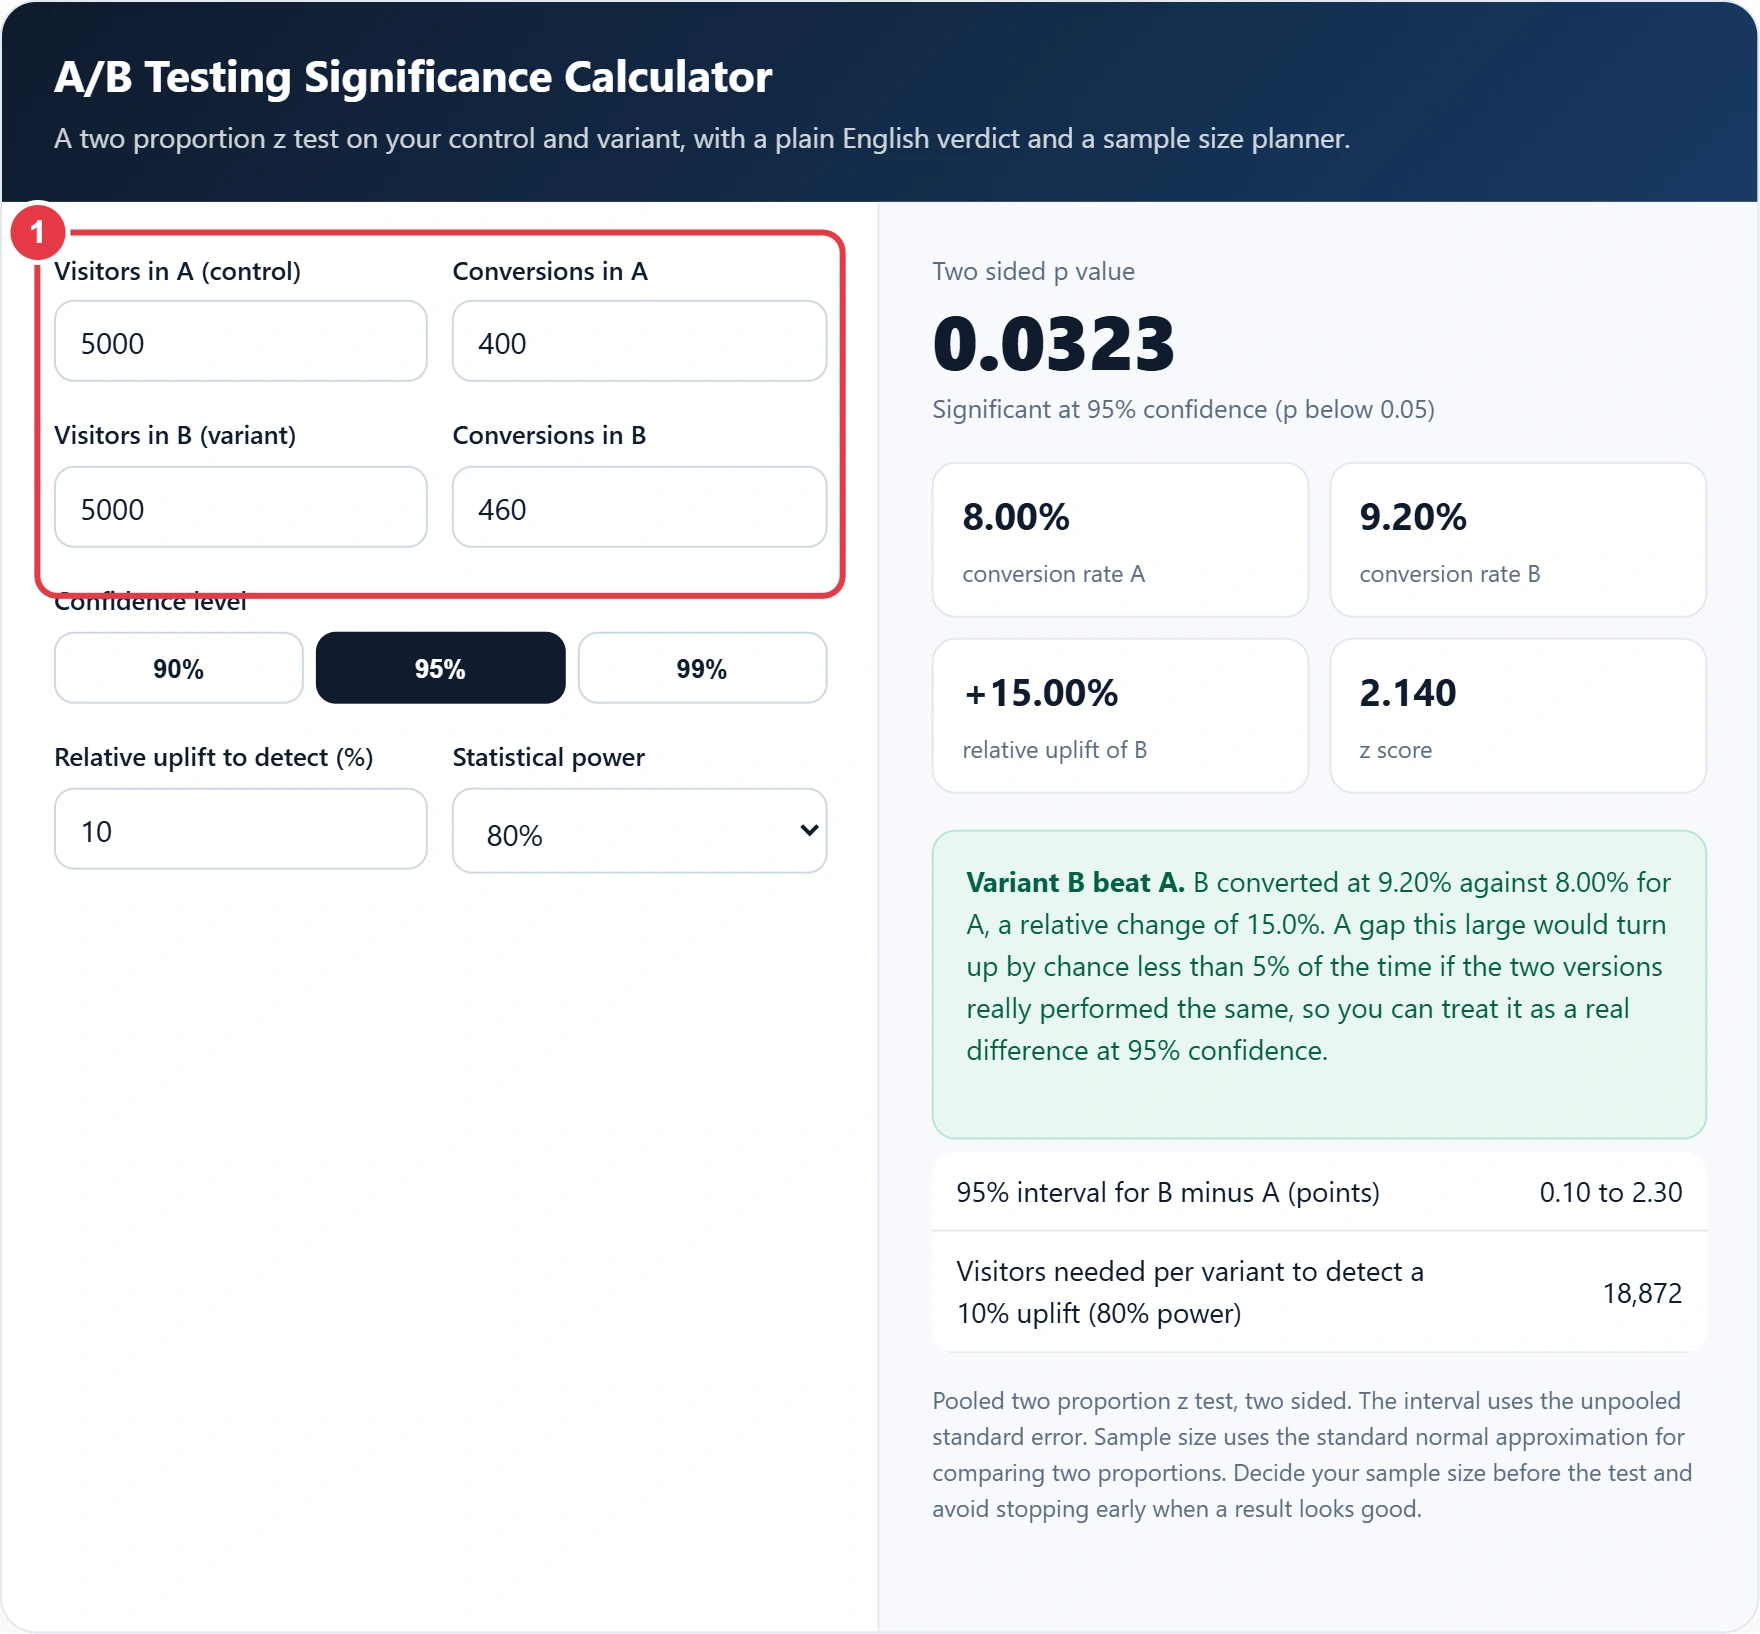
Step 1: Enter Results for A and B
Type the visitors and conversions for your control (A) and your variant (B). Use unique visitors who were actually shown each version, from the same dates.
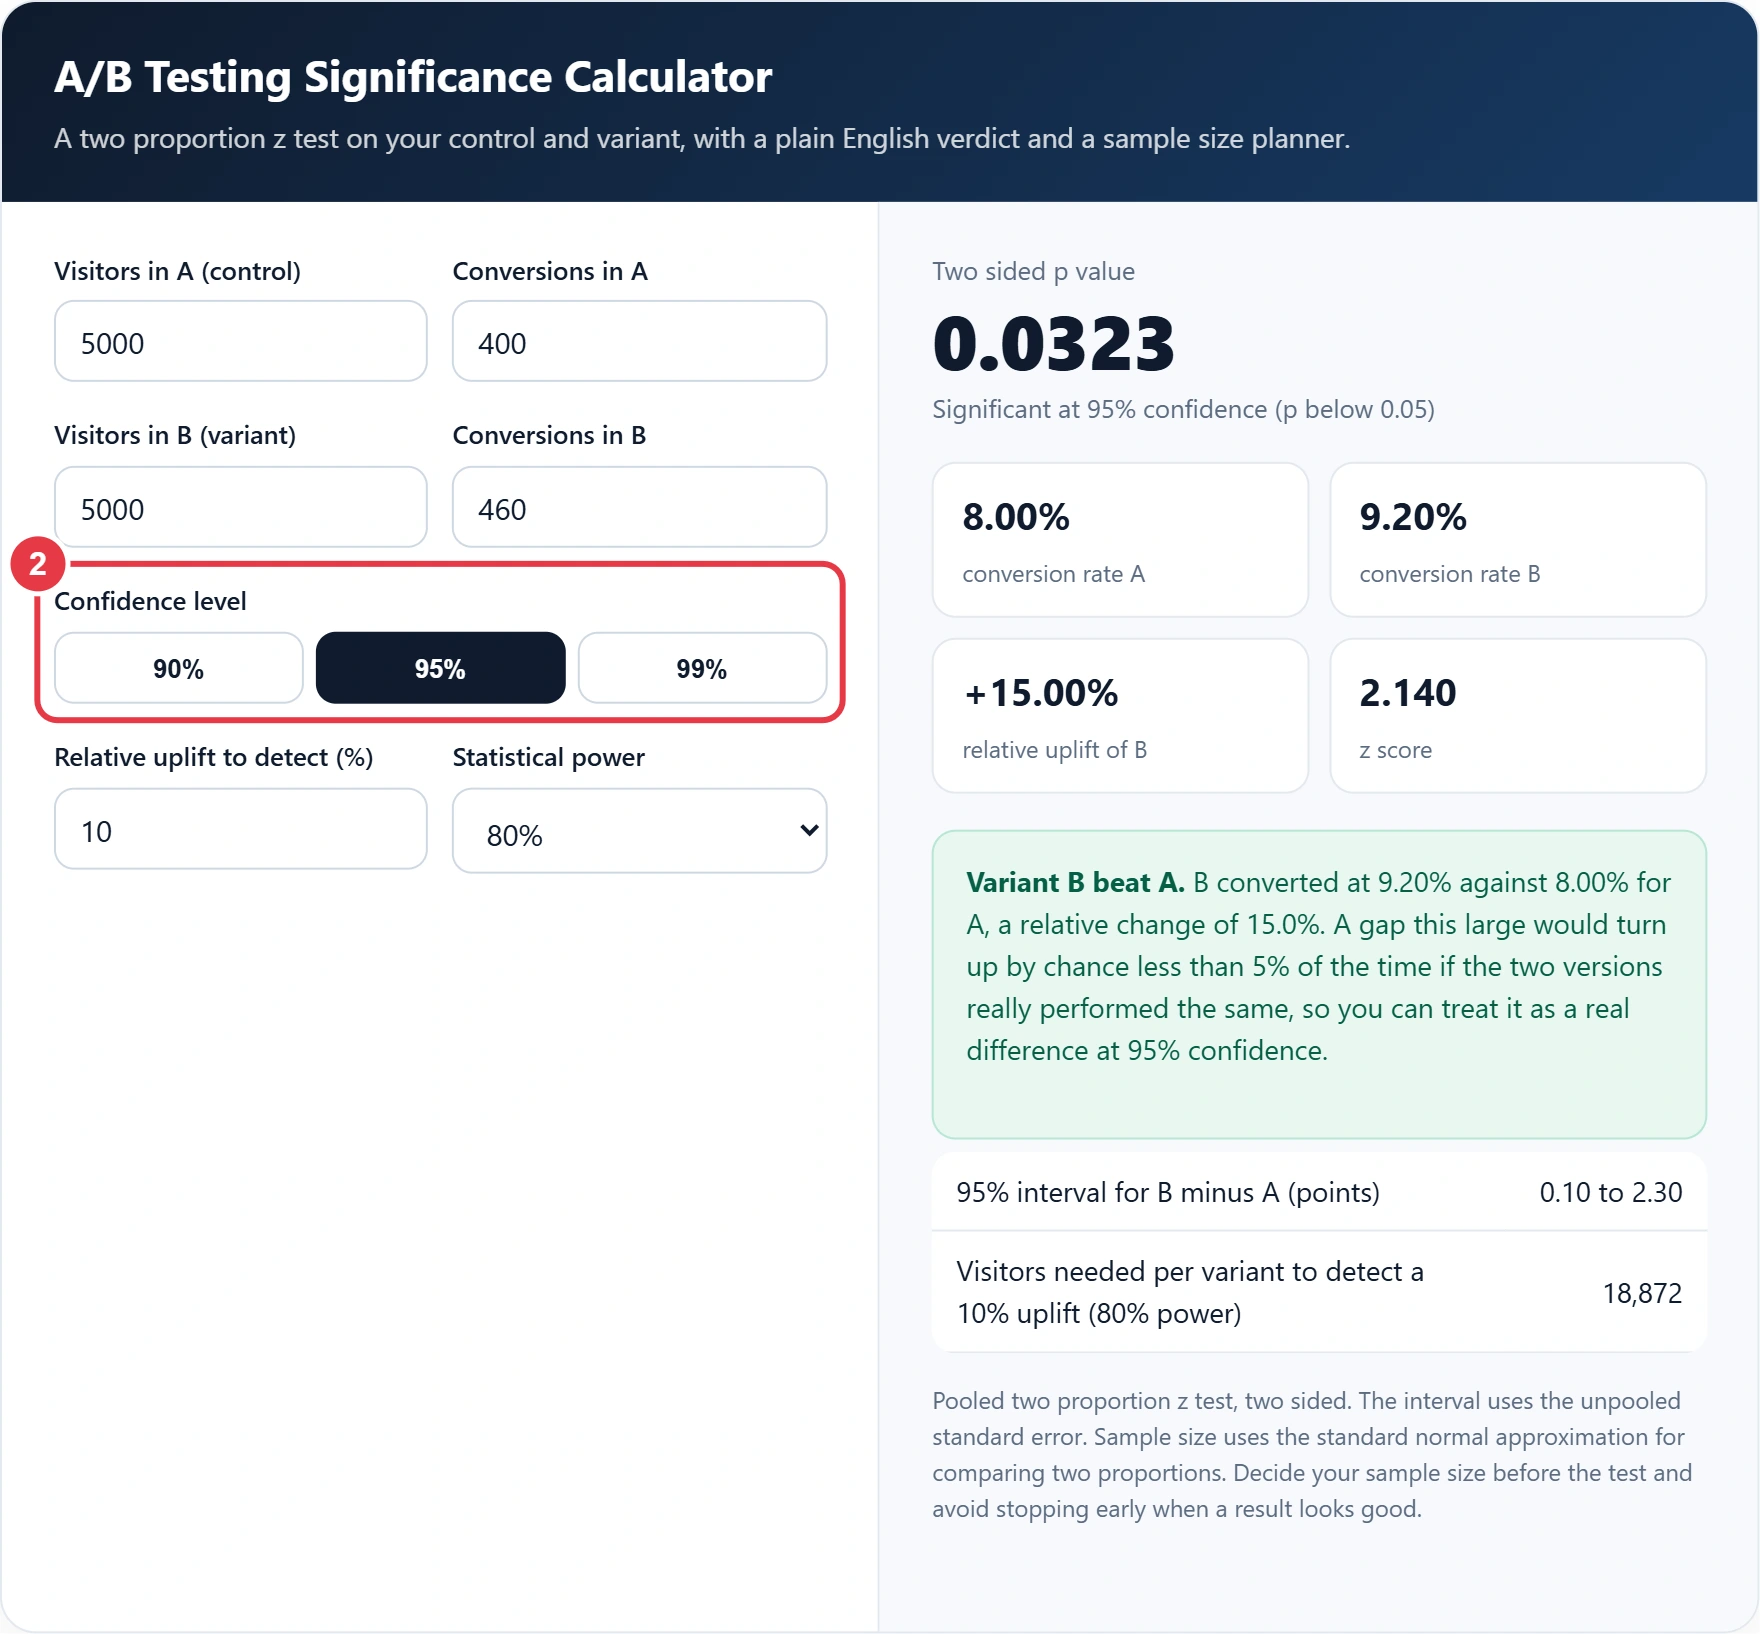
Step 2: Choose a Confidence Level
95% is the usual choice. Use 99% for expensive or hard to reverse changes such as pricing, and 90% only for quick, low risk tweaks where a wrong call costs little.
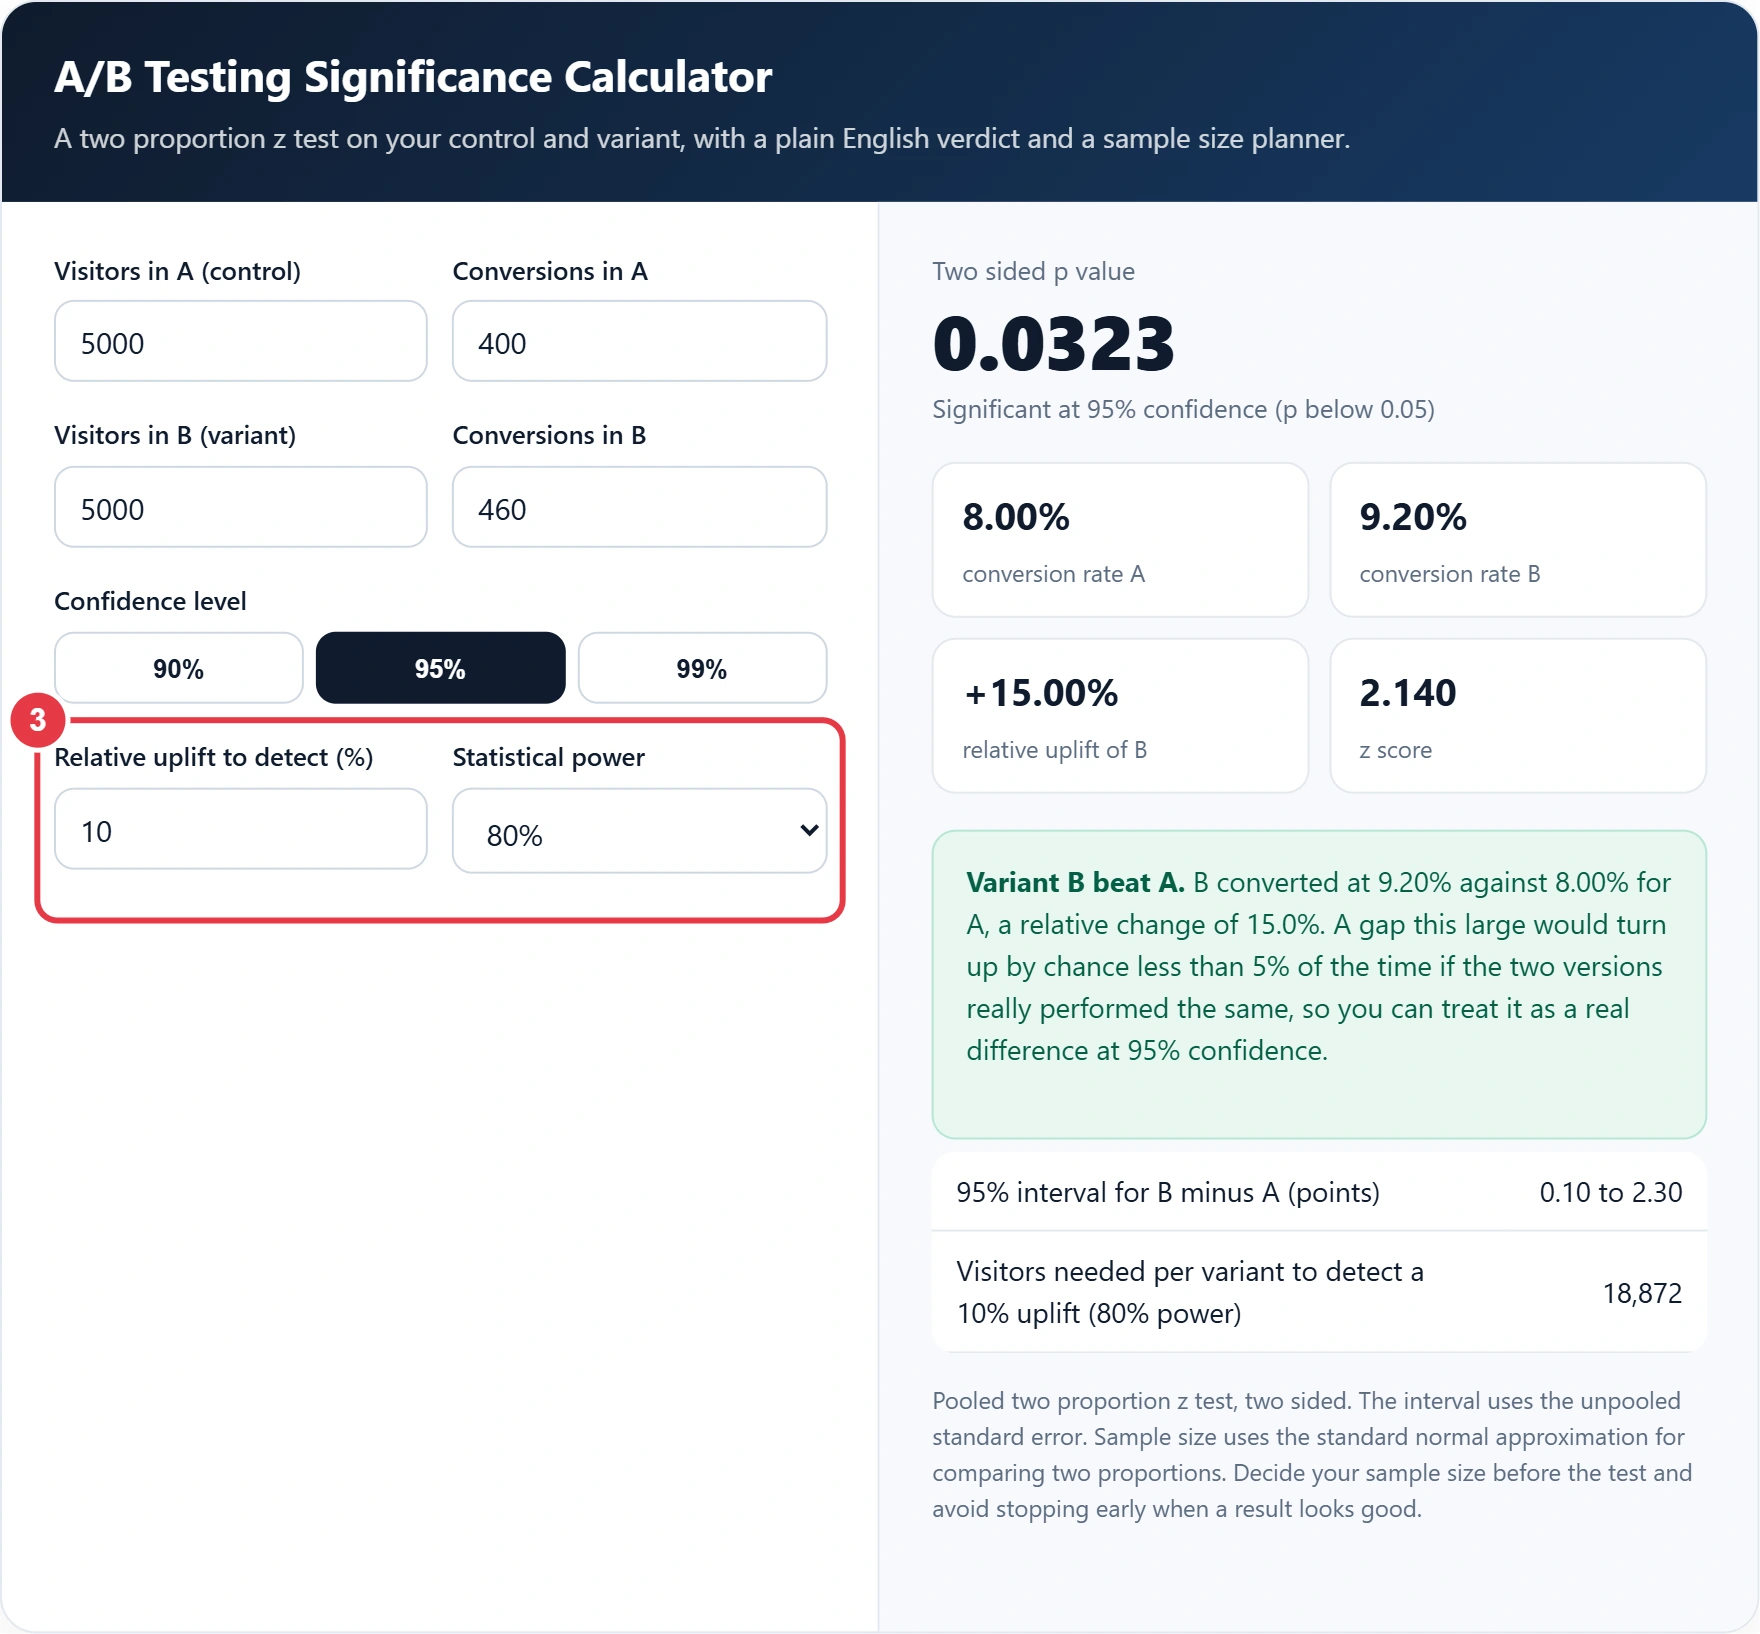
Step 3: Plan the Sample Size
Enter the smallest relative uplift worth detecting and choose 80% or 90% power. The planner uses A's rate as the baseline. If you are unsure what uplift means in pounds, the percentage difference calculator helps you compare two rates quickly, so you can set a target that is worth the traffic.
Step 4: Read the Verdict
You will see the p value, each group's rate, the relative uplift, the z score, a confidence interval for the gap in percentage points and the visitors needed per variant. The coloured box explains the outcome in everyday language.
Worked Example: Testing a New Product Page
Aisha runs a skincare shop and tests a product page with customer photos. Over two weeks, 5,000 visitors saw the old page and 400 bought (8.0%), while 5,000 saw the new one and 460 bought (9.2%). That is a 15% relative uplift. The pooled rate is 8.6%, the z score is 2.140 and the two sided p value is 0.0323, so the result is significant at 95% but not at 99%.
| Measure | Version A | Version B |
|---|---|---|
| Visitors | 5,000 | 5,000 |
| Conversions | 400 | 460 |
| Conversion rate | 8.00% | 9.20% |
| p value (two sided) | 0.0323 | |
| Visitors per variant to detect a 10% uplift, 80% power | 18,872 | |
Notice the last row. A test sized to reliably catch a 15% uplift at 80% power needs about 8,568 visitors per variant, and for a 10% uplift that rises to 18,872, more than twice as many. Aisha got a significant result with 5,000 per group, but a test that small would miss a genuine 15% gain a large share of the time. Before you start, the average calculator helps you work out typical daily visitors, which tells you how many days a properly sized test will take to run.
The method here matches the large sample approach in the NIST engineering statistics handbook, which also points to Fisher's exact test for very small samples where the z test becomes unreliable.
A/B Testing Significance Terms You Should Know
These statistical terms explain what the A/B testing significance calculator reports, so you can judge whether a winning variant reflects a real improvement.
- Two-proportion z-test
- A hypothesis test that compares two conversion rates by dividing their difference by a pooled standard error. The resulting z score shows how many standard errors apart the rates are, which is then translated into a p value.
- P-value
- The probability of seeing a difference at least as large as the observed one if the two versions truly performed the same. A small value signals surprising data, but it does not state the chance that version B is better.
- Confidence level
- The threshold of certainty chosen before testing, commonly 90%, 95% or 99%. Higher levels lower the risk of declaring a false winner but demand larger samples, so the choice should reflect how costly a wrong decision would be.
- Statistical power
- The probability that a test detects a genuine effect of a chosen size, usually set at 80% or 90%. Low power means real improvements are often missed, which is why the sample size planner asks for it.
- Minimum detectable effect
- The smallest relative uplift a test is designed to identify reliably. Smaller targets require far more traffic: detecting a 10% uplift at 80% power on an 8% baseline needs 18,872 visitors in each variant.
- Confidence interval
- A range of plausible values for the true difference between the two conversion rates. When the interval for B minus A excludes zero, the result is significant at the matching confidence level, and its width shows how precise the estimate is.
</>Embed this calculator on your website
Add the free A/B Test Significance Calculator to your own site or blog. Copy the code below and paste it into an HTML block. It resizes itself and works on phones.
How we checked this tool: the Tools Veria Editorial Team built this tool by hand, checked it against the official rules or published standards where they apply, and tested it against worked examples. Results are estimates for planning, not personal financial or tax advice. Read our editorial policy and disclaimer, or report an error.
Frequently Asked Questions
What p value counts as significant in an A/B test?
Most teams use 0.05, which matches 95% confidence. A p value of 0.0323 passes at 95% but fails at 99%, where it would need to be below 0.01.
Can I stop my test as soon as it becomes significant?
It is better not to. Checking every day and stopping at the first significant result greatly raises the chance of a false winner. Fix the sample size first and run to it.
Why do I need so many visitors to detect a small uplift?
The sample size grows roughly with one over the square of the difference, so halving the uplift you want to detect needs about four times the visitors.
Is a 95% confidence level the same as a 95% chance B is better?
No. It means a gap this big would appear by chance less than 5% of the time if A and B really performed the same.
What does statistical power mean?
Power is the chance your test spots a real uplift of the size you set. At 80% power, one in five genuine improvements of that size would still be missed.
Can I use this calculator for more than two variants?
It compares two groups at a time. With several variants, comparing each to the control raises the risk of a false positive, so use a stricter confidence level such as 99%.