Z-score, percentile and normal probabilities from a score, two scores, a percentile or a whole data set.
Percentiles and probabilities assume the scores follow a normal distribution. The z-score itself is valid for any data.
This z-score calculator tells students, teachers, researchers and analysts how far a score sits from the average in standard deviations, then turns that into a percentile and a probability. It follows the standard definition of a standard score, finds the score for any percentile, works out the chance of falling between two values, and z-scores a whole data set with a shaded normal curve and the working shown.
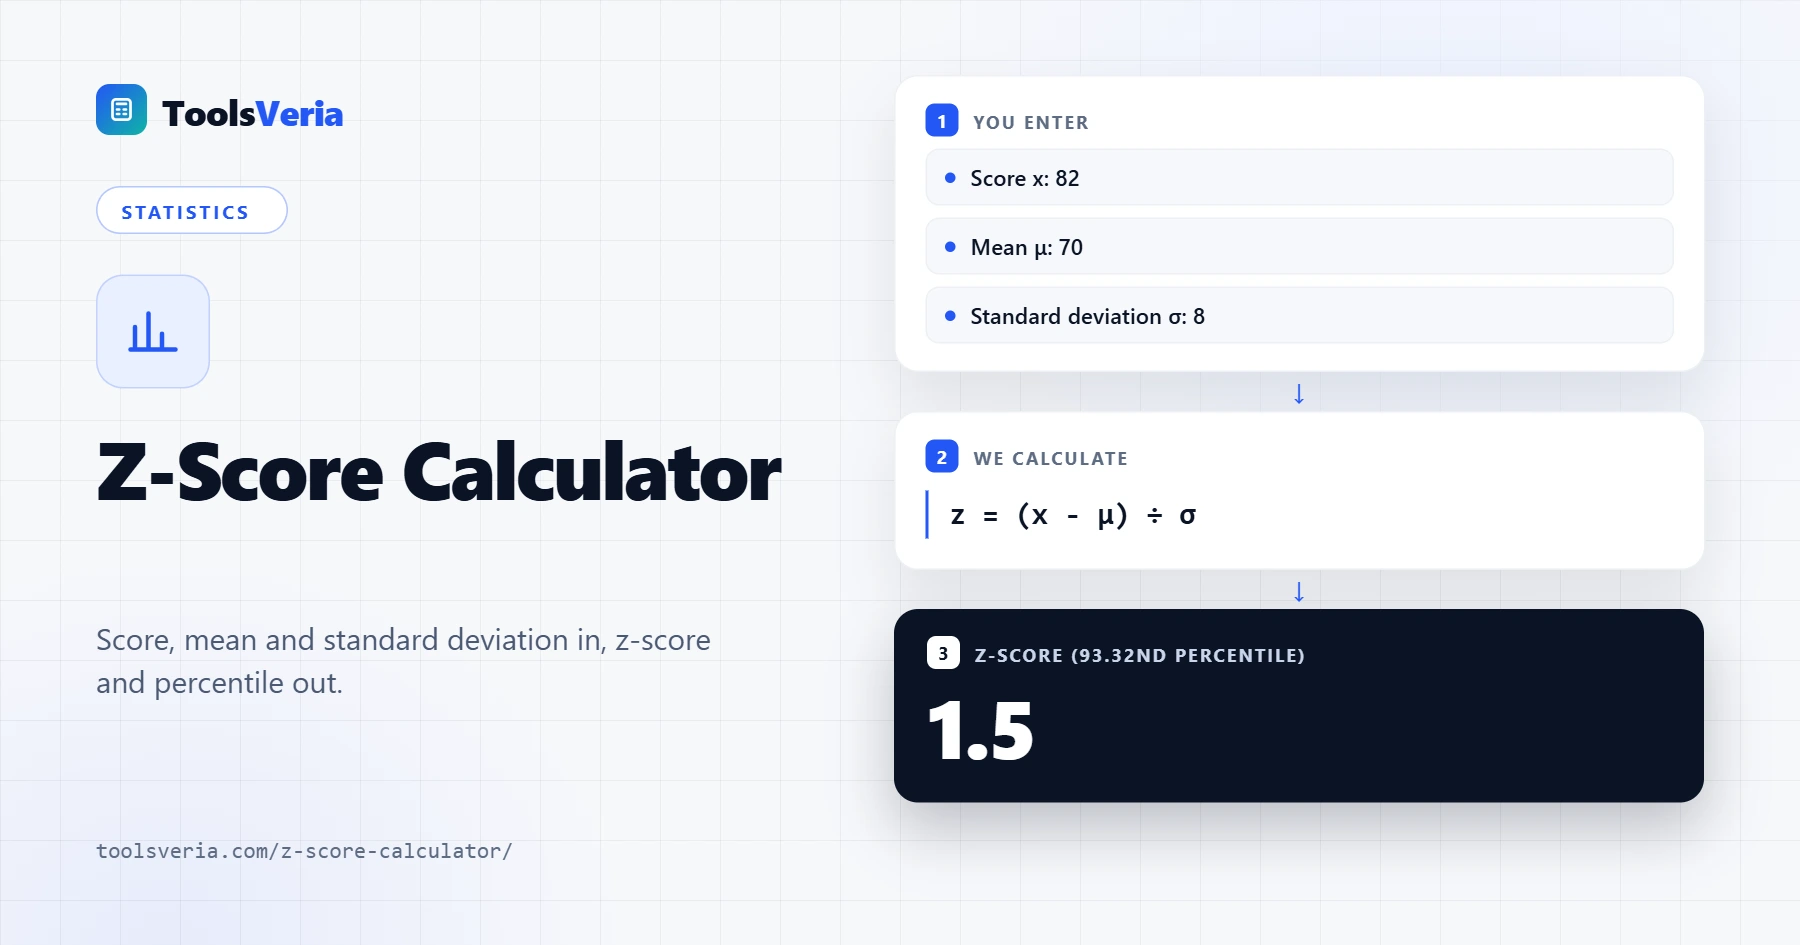
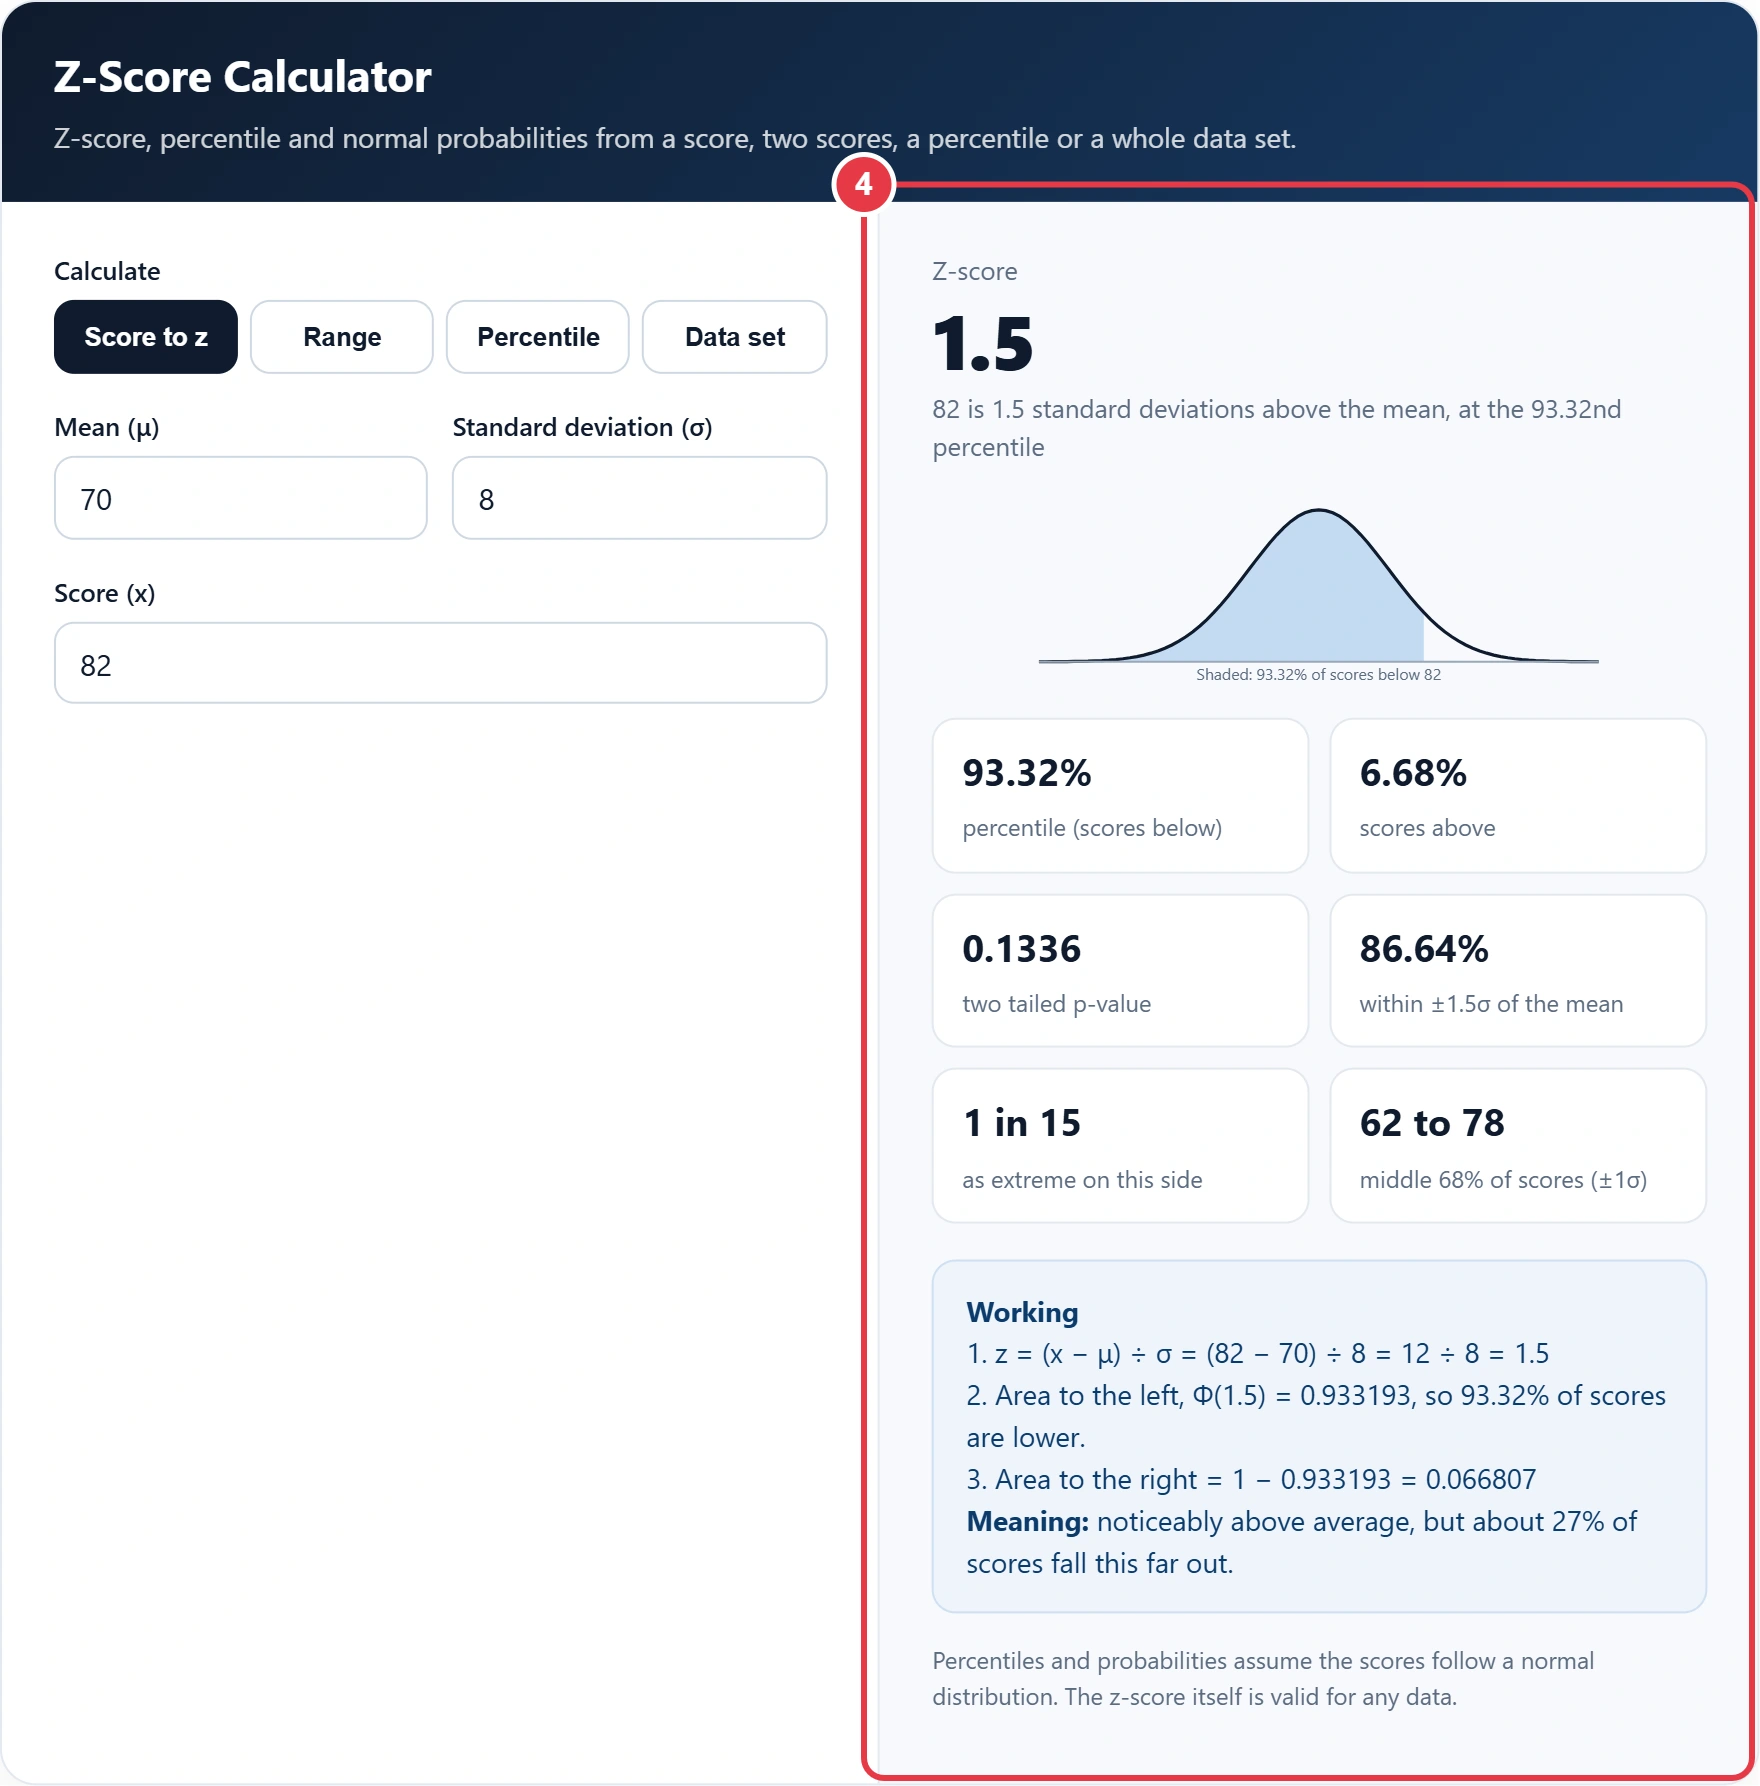
Quick answer: a z-score is (score minus mean) ÷ standard deviation. A test mark of 82 where the mean is 70 and the standard deviation is 8 gives z = 12 ÷ 8 = 1.5. The z-score calculator converts that to the 93.32nd percentile, so the mark beats about 93% of scores.
In This Guide
What Is a Z-Score?
A z-score, or standard score, is the number of standard deviations a value lies above or below the mean of its group. A z-score of 0 is exactly average, plus 2 is two standard deviations above, and minus 1 is one below.
The formula in plain words: subtract the mean from the score, then divide by the standard deviation. Because every result is measured in the same unit, standard deviations, z-scores let you compare marks from different tests, heights from different age groups or sales from different shops on one scale. When your figures come from a sample rather than a whole population, the mean is usually written x̄ and the standard deviation s, and the data mode lets you choose which version to use.
How to Use the Z-Score Calculator
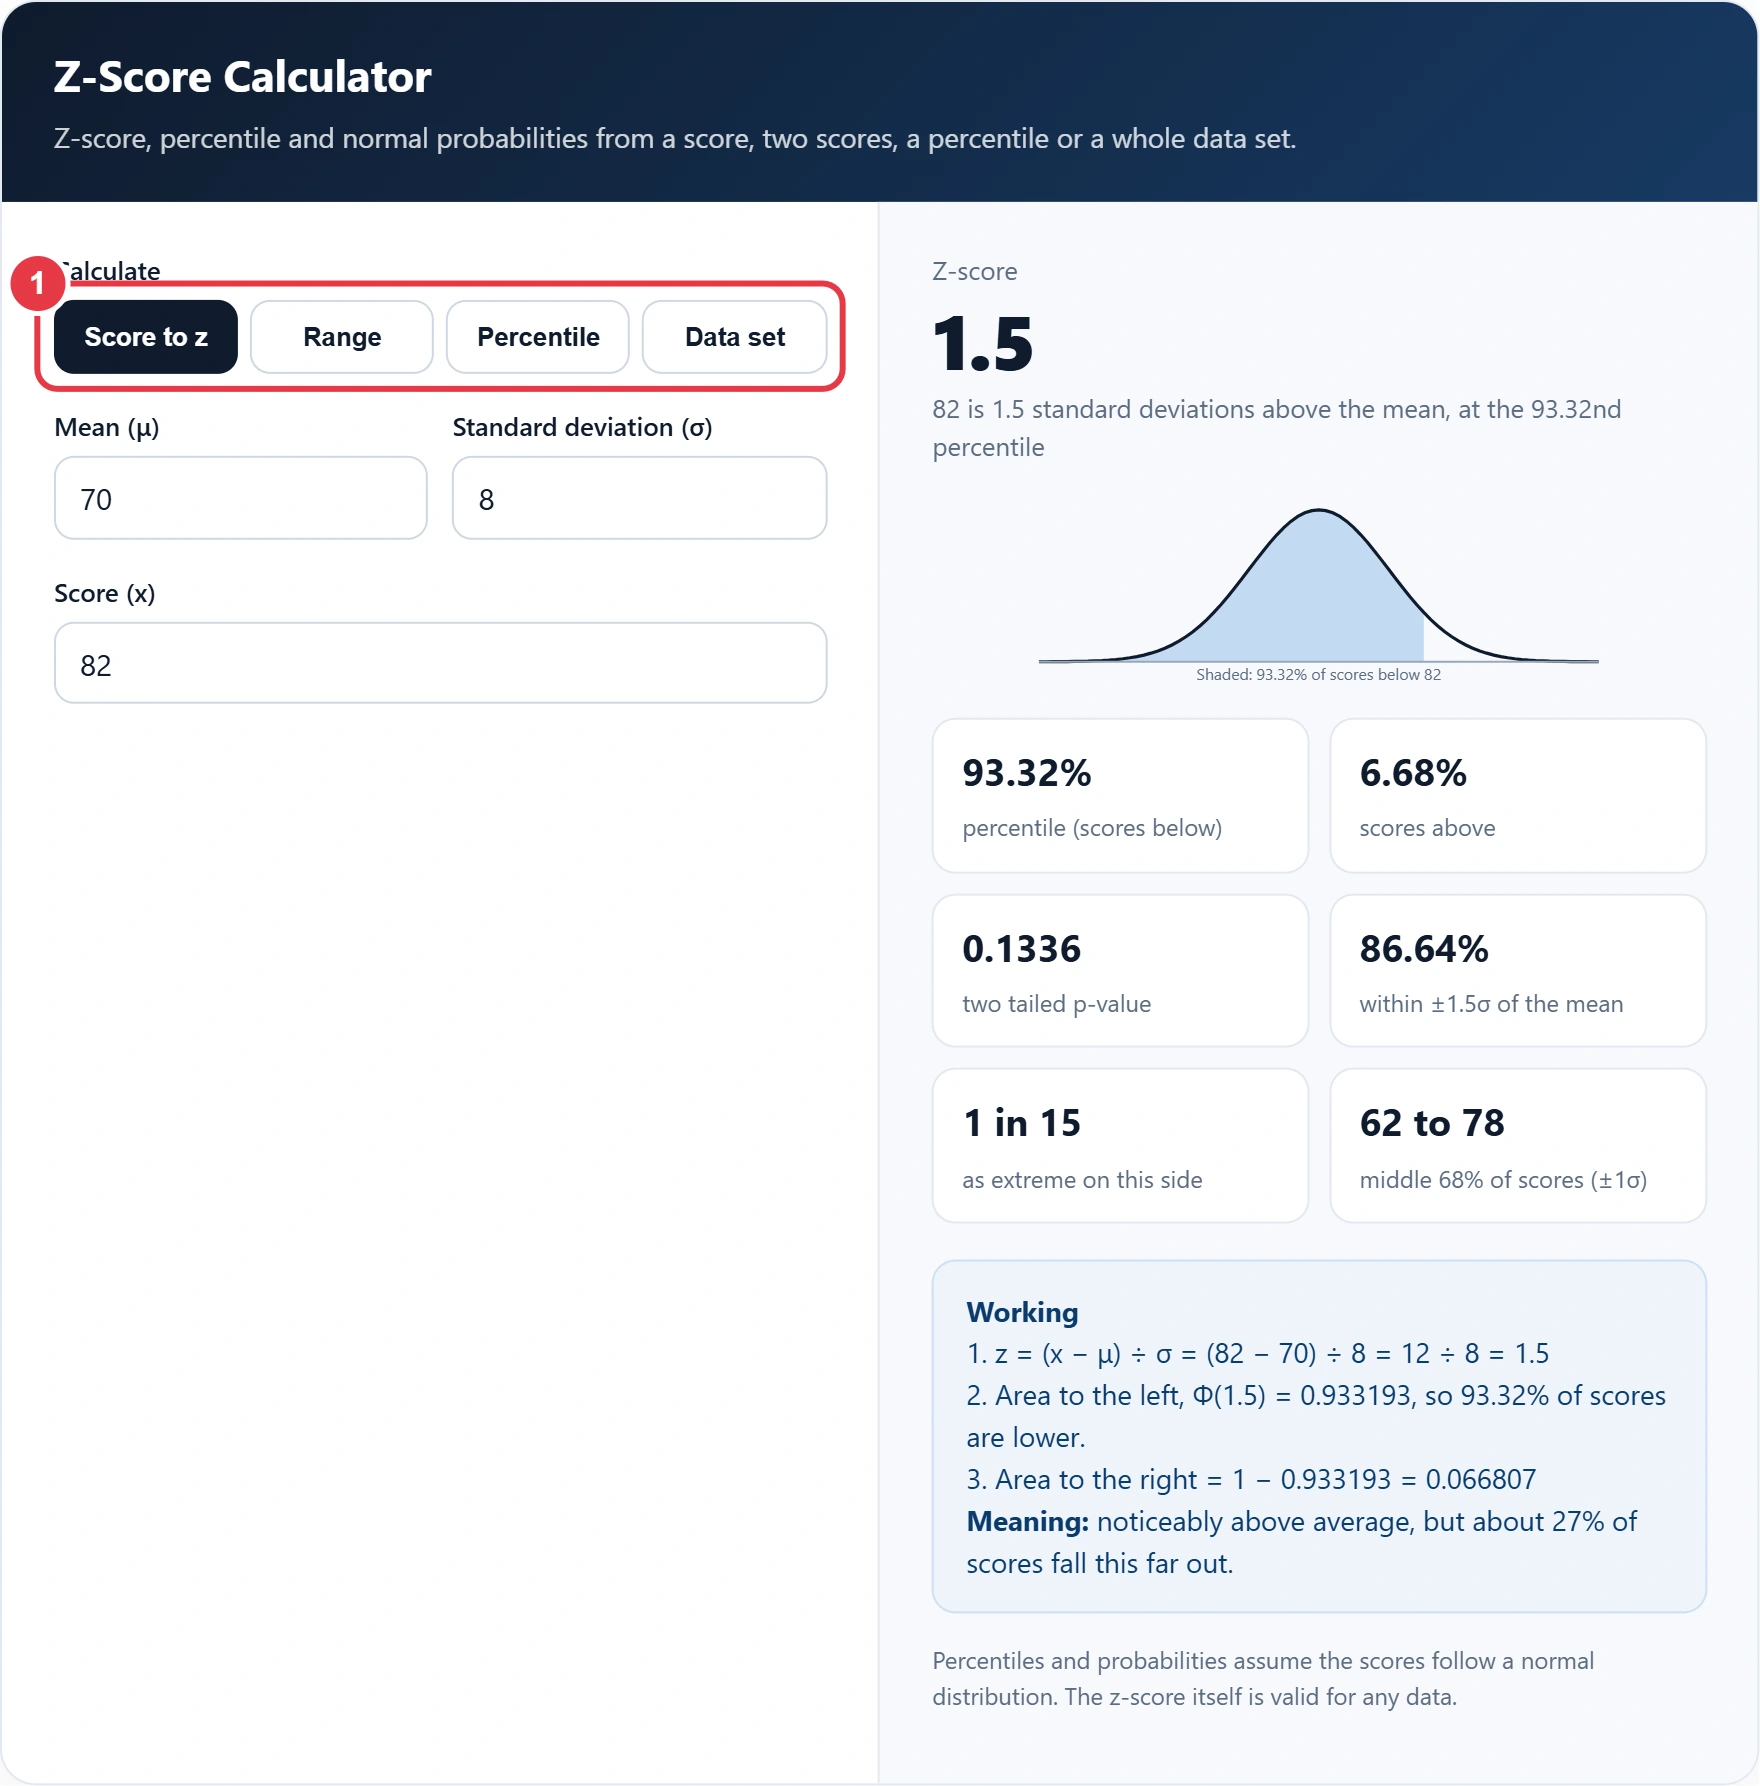
Step 1: Choose the Calculation
Pick Score to z for one value, Range for the chance of falling between two scores, Percentile to work backwards to a score, or Data set to paste a list and get the mean, standard deviation and a z-score for every value.
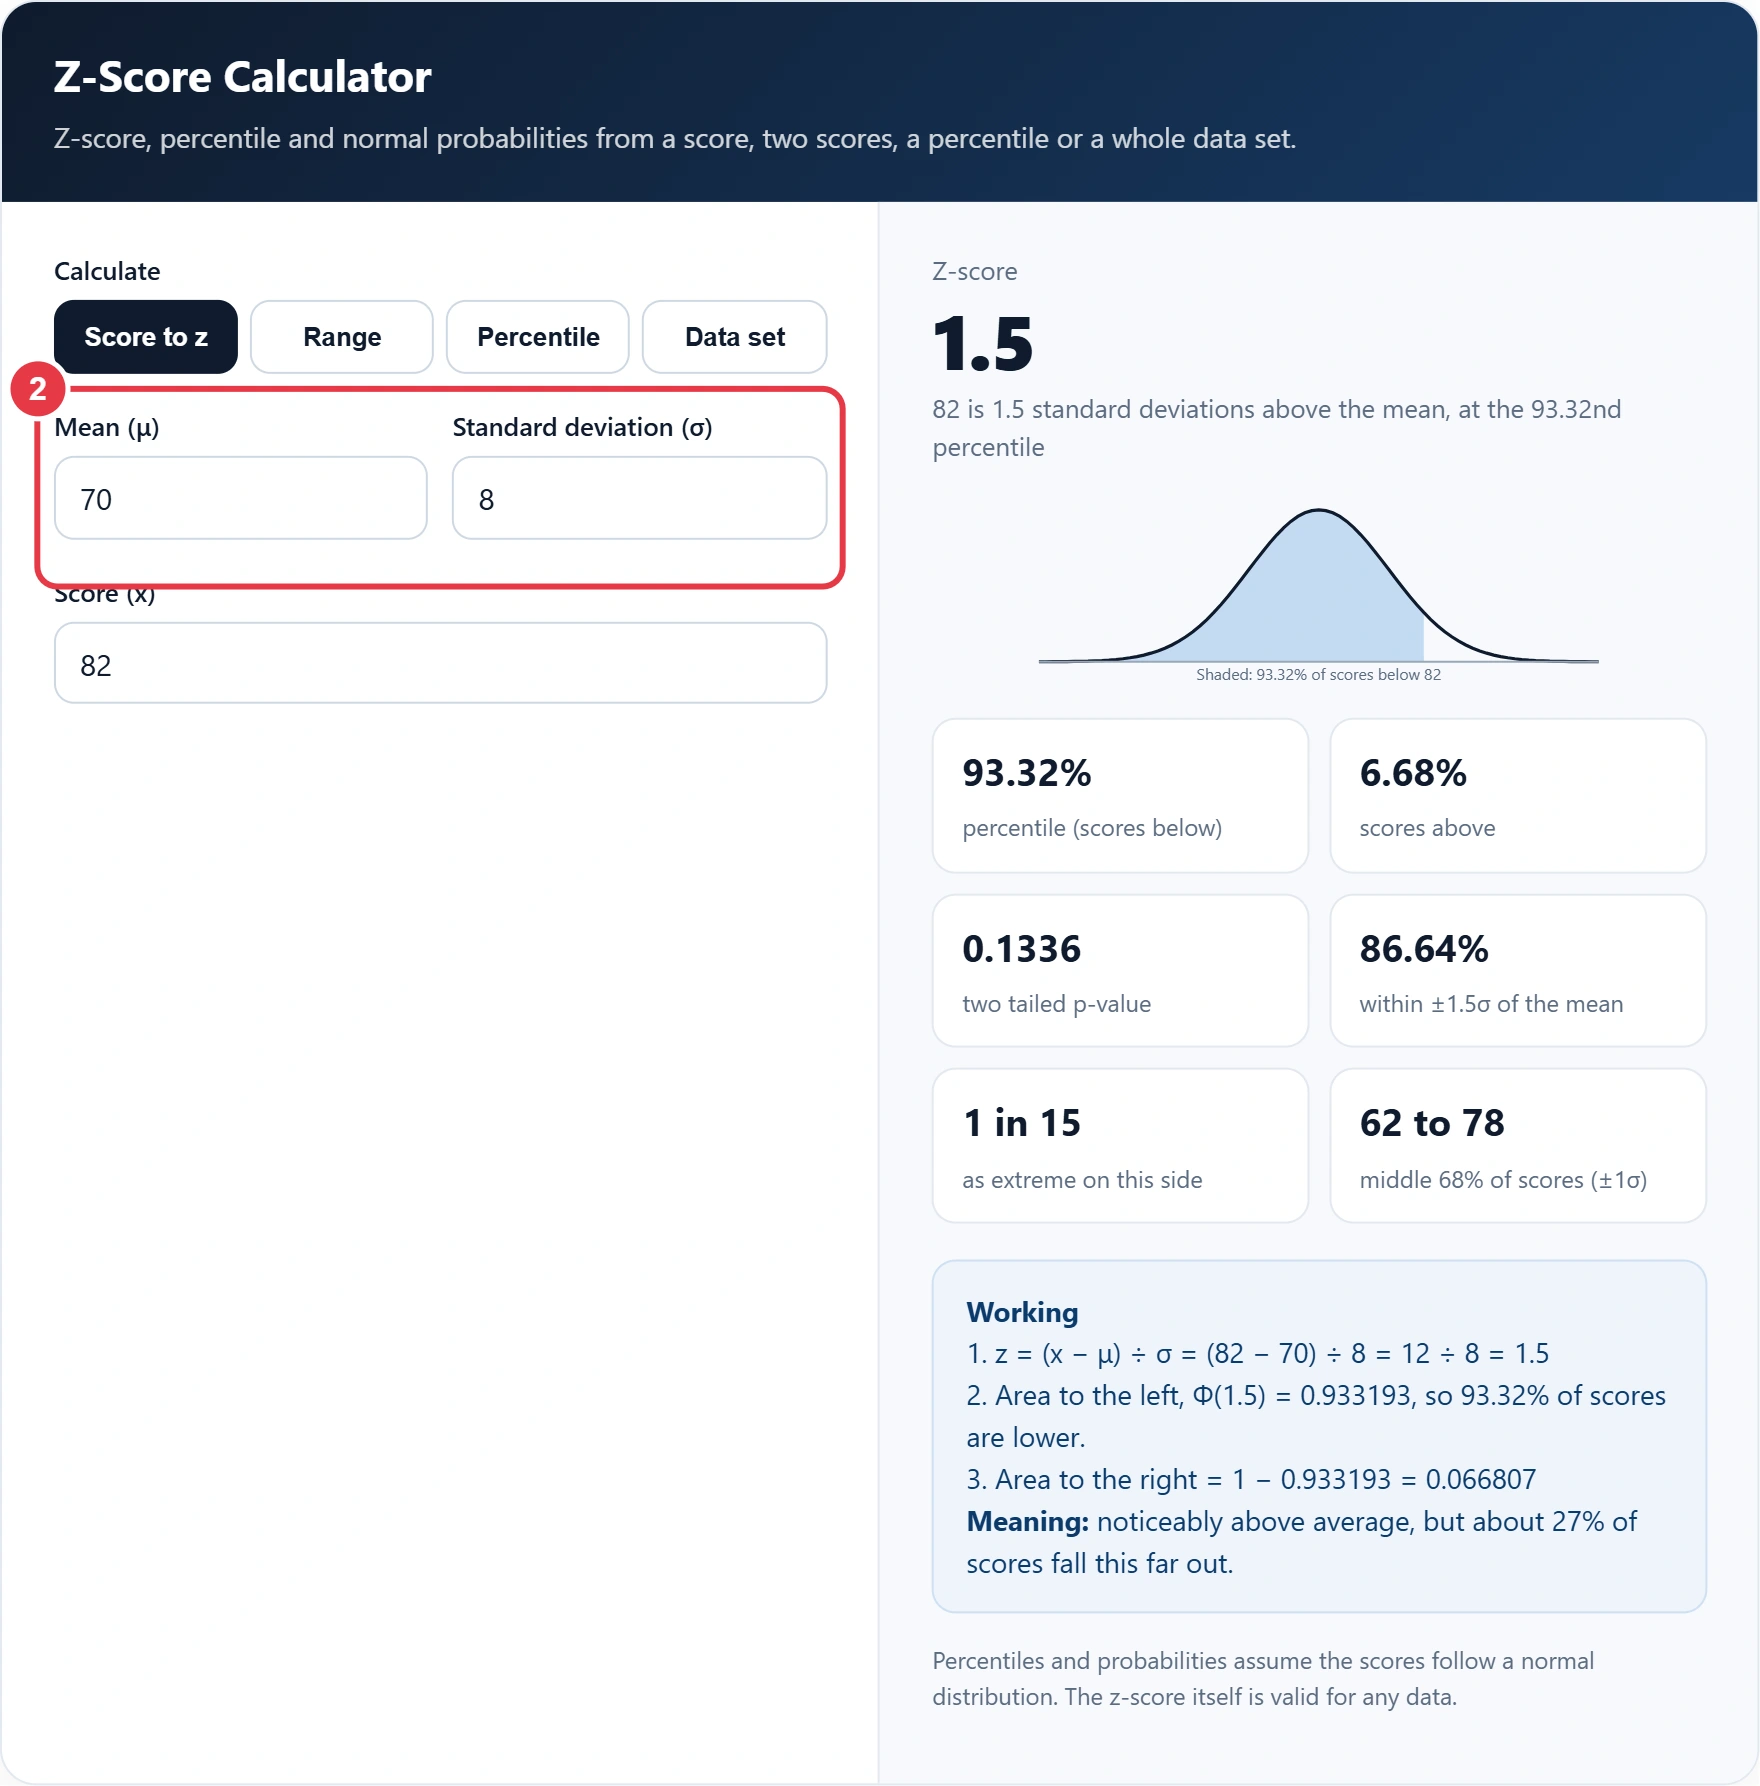
Step 2: Enter the Mean and Standard Deviation
Use the mean and standard deviation of the group the score belongs to. If you only have raw marks, the average calculator finds the mean, or switch to Data set and let this tool do both.
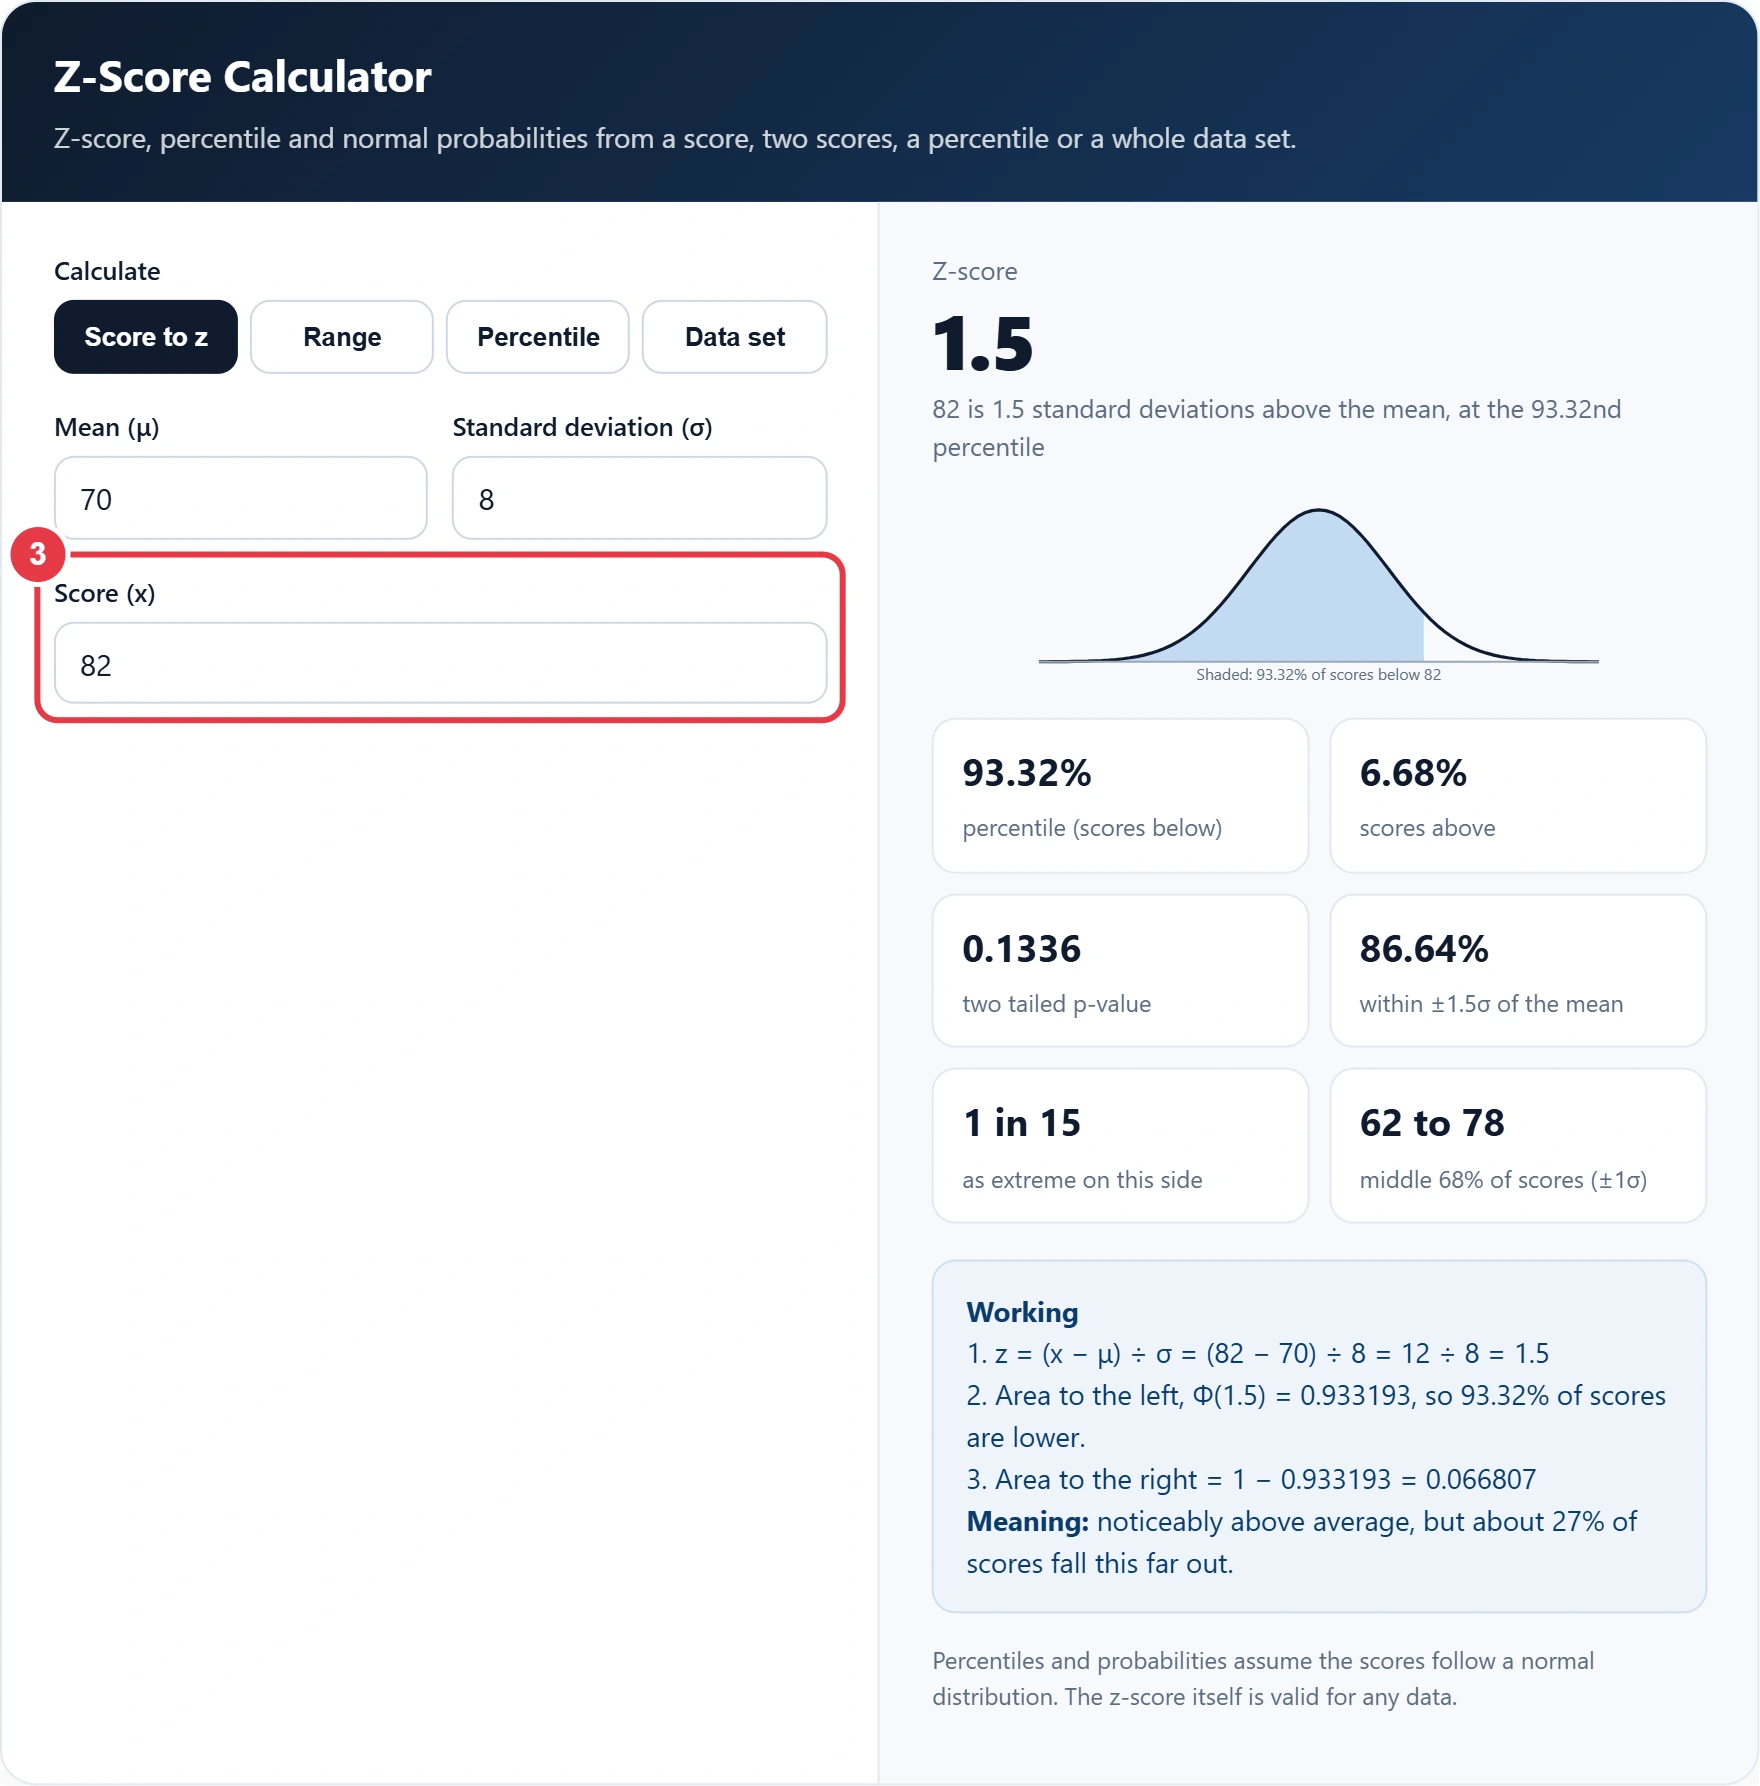
Step 3: Enter the Score
Type the individual value you want the z-score calculator to standardise. Scores below the mean give negative z-scores, which is normal and simply means below average.
Step 4: Read the Z-Score and Percentile
You see the z-score, the percentile, the share of scores above, the two tailed p-value and a shaded bell curve, plus a plain English verdict on how unusual the score is.
What Does a Z-Score Tell You?
A z-score tells you how a value compares with its own group, so you can rank results that were measured on different scales. The sign gives the direction and the size gives the distance from average.
Worked example: Hannah scores 82 in maths, where her year's mean is 70 with a standard deviation of 8, and 75 in English, where the mean is 64 with a standard deviation of 10. Her maths z-score is (82 minus 70) ÷ 8 = 1.5, the 93.3rd percentile. Her English z-score is (75 minus 64) ÷ 10 = 1.1, the 86.4th percentile. The raw marks are only 7 apart, but relative to her classmates the maths result is clearly the stronger one.
How Do You Convert a Z-Score to a Percentile?
Find the share of scores below your z-score and multiply by 100: that share is the area to the left of z under the standard normal distribution, which printed z tables list to four decimal places. The z-score calculator works it out to six decimal places for any z, so you never need to interpolate between rows of a table.
For example, z = 1.5 has an area of 0.933193 to its left, so it sits at the 93.32nd percentile, and 6.68% of scores are higher. The common cut offs below are worth knowing by heart.
| z-score | Percentile (below) | Common use |
|---|---|---|
| 0 | 50% | Exactly average |
| 1 | 84.13% | One standard deviation above |
| 1.645 | 95% | One tailed 5% test |
| 1.96 | 97.5% | 95% confidence interval |
| 2.576 | 99.5% | 99% confidence interval |
| 3 | 99.87% | Common outlier threshold |
What Is a Good or Unusual Z-Score?
Between minus 1 and 1 is typical, beyond 2 in either direction is unusual, and beyond 3 is rare enough to check for errors. That follows the empirical rule: in a normal distribution about 68.27% of values lie within 1 standard deviation, 95.45% within 2 and 99.73% within 3. A good z-score depends on the context: high is good for exam marks, but for a blood test or a delivery time you may want to be close to 0.
Watch for outliers inflating the spread. In the sample data of 12 marks, the 98 has a z-score of only 2.71, because that one high mark also pushes the standard deviation up to 8.99. For comparing two conversion rates, the A/B testing significance calculator runs the matching two proportion z-test for you. Formulas checked October 2026.
Key Z-Score Calculator Terms Explained
These definitions explain the statistics behind the z-score calculator, helping you interpret standard scores, percentiles and probabilities correctly for tests, research and data sets.
- Mean
- The arithmetic average of a set of values, found by adding them and dividing by how many there are. It is the reference point for a z-score, so values above it give positive scores and values below it give negative ones.
- Standard deviation
- A measure of how widely values spread around the mean, calculated as the square root of the average squared distance from it. It is the unit of a z-score, so the same raw gap means more in a tightly grouped set.
- Normal distribution
- A symmetrical, bell shaped probability distribution described by its mean and standard deviation. Converting a z-score into a percentile assumes data roughly follows this shape, although the z-score itself is valid for any data.
- Percentile
- The percentage of values in a distribution that fall below a given score. Under the normal curve, each z-score maps to one percentile, which makes results easy to explain to people unfamiliar with statistics.
- Sample standard deviation
- A version of standard deviation that divides by one less than the number of values, known as Bessel's correction. It is used when data is a sample from a larger population, giving a slightly larger, less biased estimate.
- Two tailed p-value
- The probability of a result at least as far from the mean in either direction as the observed score, assuming a normal distribution. Small values indicate a score that would be unusual by chance alone.
</>Embed this calculator on your website
Add the free Z-Score Calculator to your own site or blog. Copy the code below and paste it into an HTML block. It resizes itself and works on phones.
How we checked this tool: the Tools Veria Editorial Team built this tool by hand, checked it against the official rules or published standards where they apply, and tested it against worked examples. Results are estimates for planning, not personal financial or tax advice. Read our editorial policy and disclaimer, or report an error.
Frequently Asked Questions
How do you calculate a z-score?
Subtract the mean from the score and divide by the standard deviation: z = (x minus μ) ÷ σ. A score of 82 with a mean of 70 and a standard deviation of 8 gives a z-score of 1.5.
What does a negative z-score mean?
A negative z-score means the value is below the mean. A z-score of minus 1 is one standard deviation below average and sits at about the 15.87th percentile of a normal distribution.
What percentile is a z-score of 2?
A z-score of 2 is at about the 97.72nd percentile, so roughly 97.7% of values in a normal distribution are lower and about 2.28% are higher.
What z-score is the 90th percentile?
The 90th percentile is a z-score of about 1.2816. With a mean of 70 and a standard deviation of 8, the score at the 90th percentile is 70 + 1.2816 × 8 = 80.25.
Should I use the sample or population standard deviation?
Use the population formula, dividing by n, when your data covers the whole group. Use the sample formula, dividing by n minus 1, when the data is a sample used to estimate a larger group.
Can I use z-scores if my data is not normal?
Yes, the z-score itself still shows distance from the mean in standard deviations. The percentile and p-value conversions assume a normal distribution, so treat them as approximate for skewed data.