
Amira put £5,000 into a global index fund in January 2019. Seven years later the statement says £8,200, but some years were up 22% and one was down 8%. Learning how to calculate CAGR lets her turn that messy record into one honest number: the steady yearly rate that would have produced the same result. The same method works for a business turning over $240,000 or a house price in euros.
Below you will find the formula in plain words, three ways to do it in a spreadsheet, how to handle part years, and the traps that make CAGR look better or worse than reality.
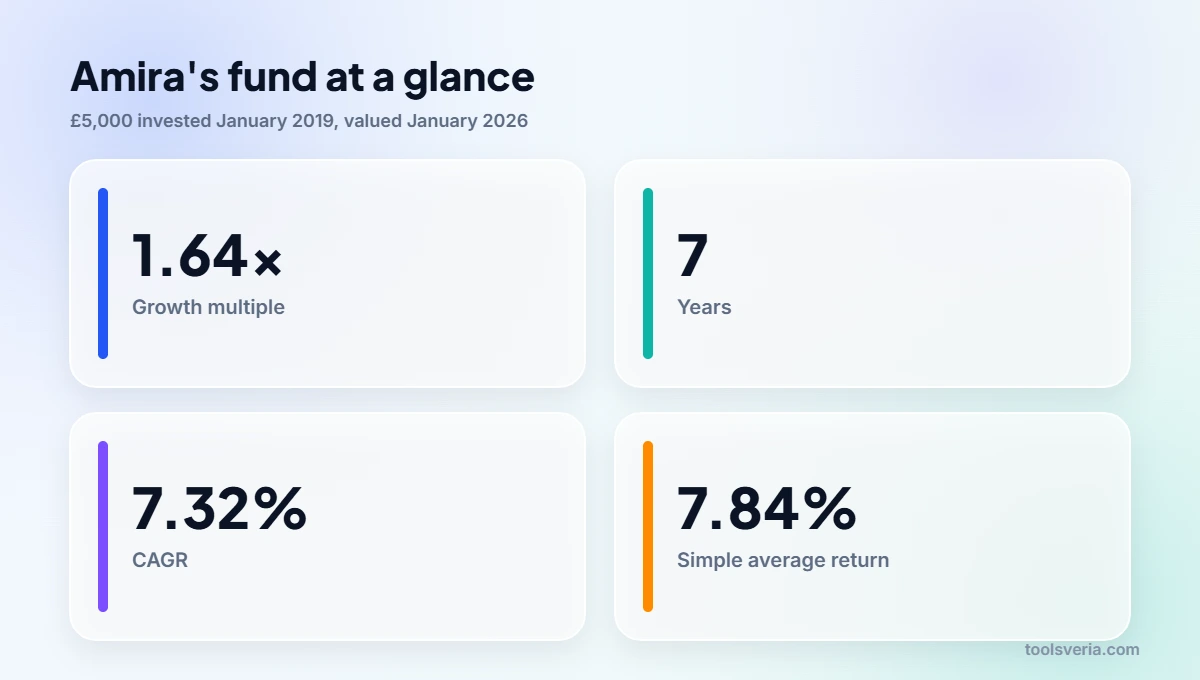
Quick answer: To calculate CAGR, divide the ending value by the starting value, raise the result to the power of 1 divided by the number of years, then subtract 1. £5,000 growing to £8,200 over 7 years gives 1.64 to the power of 1/7, minus 1, which is 7.32% a year. Formula checked October 2026.
In This Guide
What does CAGR actually measure?
CAGR, the compound annual growth rate, measures the single fixed yearly percentage that would carry a starting value to an ending value over a set number of years, assuming every gain is reinvested. It is a smoothed rate: it ignores the route taken and looks only at where you started and where you finished.
That makes it ideal for comparing things that grew over different lengths of time. A fund that doubled in ten years and a shop whose sales rose 60% in four years cannot be compared by their total growth, yet their CAGRs (7.18% and 12.47%) sit side by side neatly. Mathematically, CAGR is the geometric mean of the yearly growth factors, minus one, which the Wikipedia entry on compound annual growth rate sets out in full.
How to calculate CAGR step by step
Calculating CAGR takes four steps: find the growth multiple, find the number of years, take the matching root, and convert the result to a percentage. Amira’s numbers show each step.
- Growth multiple. Divide the ending value by the starting value: £8,200 divided by £5,000 is 1.64. Her money grew by a factor of 1.64, or 64% in total.
- Number of years. Count the time between the two values, not the number of statements. January 2019 to January 2026 is 7 years.
- Take the root. Raise 1.64 to the power of 1/7 (about 0.1429). On a phone calculator, type 1.64, press the x to the y key and enter 0.142857. The answer is 1.0732.
- Subtract 1. 1.0732 minus 1 is 0.0732, or 7.32% a year.
Check it by running the rate forward, or let our CAGR calculator confirm it from the two dates. £5,000 multiplied by 1.0732 seven times lands on £8,200, give or take a pound of rounding. If your check misses badly, the usual culprit is a wrong year count, so always count gaps between dates rather than data points: eight yearly statements cover only seven years of growth.
Total growth and CAGR answer different questions. Our percentage increase calculator tells Amira her pot rose 64% overall, while CAGR spreads that rise evenly across the seven years.

Why is CAGR different from the average annual return?
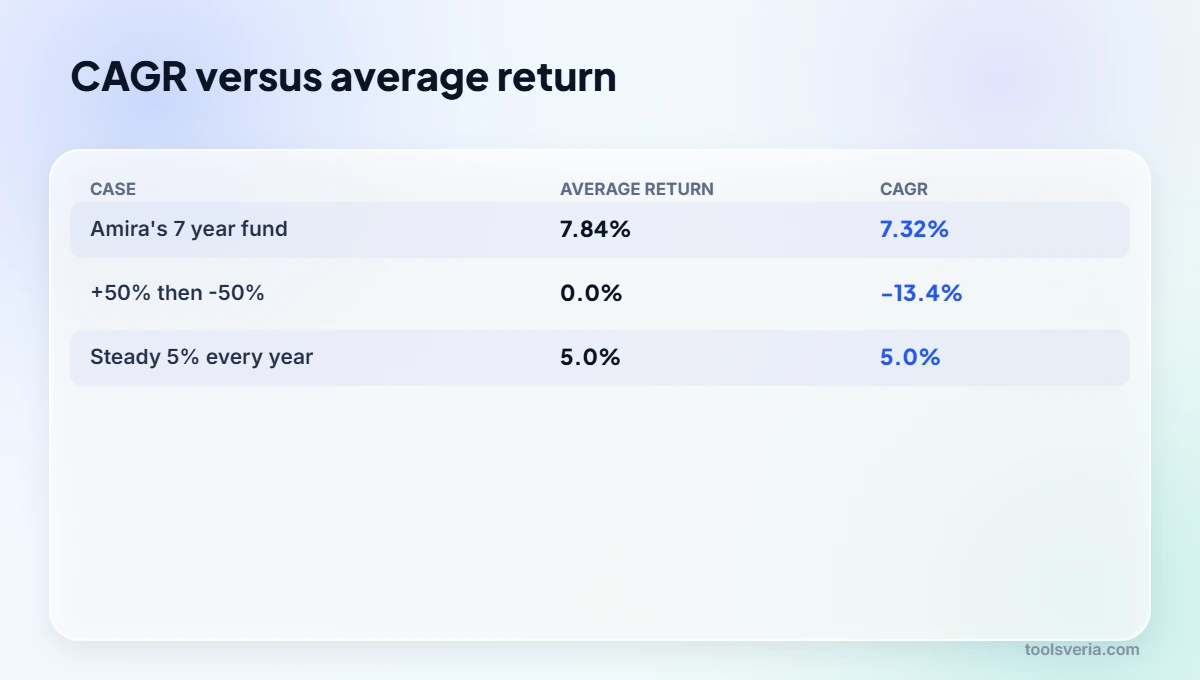
CAGR differs from the average annual return because a simple average adds percentages that actually multiply, so it overstates growth whenever returns vary from year to year. The bigger the swings, the wider the gap between the two figures.
| Year | Amira’s actual value | Return that year | Smoothed at 7.32% CAGR |
|---|---|---|---|
| Start (Jan 2019) | £5,000 | None | £5,000 |
| 1 | £5,600 | +12.0% | £5,366 |
| 2 | £5,150 | -8.0% | £5,759 |
| 3 | £6,300 | +22.3% | £6,181 |
| 4 | £7,050 | +11.9% | £6,633 |
| 5 | £6,600 | -6.4% | £7,119 |
| 6 | £7,600 | +15.2% | £7,641 |
| 7 (Jan 2026) | £8,200 | +7.9% | £8,200 |
Add up Amira’s seven yearly returns and divide by seven and you get 7.84%, about half a point higher than her true CAGR of 7.32%. Compounding £5,000 at 7.84% for seven years would promise roughly £8,480, which is about £280 more than she actually has. The arithmetic average is not wrong as a statistic; it simply answers a different question.
The starkest case is a 50% gain followed by a 50% loss. The average return is 0%, yet £1,000 becomes £1,500 and then £750. CAGR reports the truth: minus 13.4% a year. Fund factsheets often quote annualised returns for exactly this reason.
How do you calculate CAGR in Excel or Google Sheets?
You can calculate CAGR in Excel or Google Sheets with the formula =(end/start)^(1/years)-1, or with the built in RRI function, which takes the number of periods, the start value and the end value. Both programs accept the same syntax.
- Power formula: with the start in A2, the end in B2 and the years in C2, type =(B2/A2)^(1/C2)-1 and format the cell as a percentage. Amira’s sheet shows 7.32%.
- RRI: =RRI(7,5000,8200) returns 0.0732. It is the shortest option and hard to mistype.
- RATE: =RATE(7,0,-5000,8200) gives the same answer. The minus sign on the start value matters, because RATE treats money paid in as negative.
If your years are dates rather than whole numbers, compute them as =(B1-A1)/365.25 so leap years do not drift the answer. A #NUM! error almost always means a zero or negative start value.
How do you handle part years and business figures?
Part years are handled by converting the period to a decimal number of years before taking the root, so 3 years and 6 months becomes 3.5. Had Amira’s £5,000 reached £8,200 in 3.5 years, her CAGR would be 1.64 to the power of 1/3.5, minus 1, which is 15.18% a year.
Businesses use the same formula on revenue, customers or profit. Take a bakery in Ohio whose turnover rose from $240,000 in 2022 to $410,000 in 2026. That is four years, a multiple of 1.708, and a CAGR of 14.33%. In pounds or euros the arithmetic is identical, since CAGR is a ratio and the currency cancels out.
CAGR also runs in reverse for forecasts. If the bakery keeps growing at 14.33%, next year’s turnover would be about $468,750. Treat that as a scenario, not a promise. For a lump sum growing at a known rate, our rule of 72 calculator gives a quick feel for doubling time: at 7.32%, money doubles in roughly 9.8 years.
When does CAGR give a misleading answer?
CAGR gives a misleading answer when money is added or withdrawn during the period, when the start value is negative or zero, or when the chosen start and end dates flatter the result. Each case has a better tool.
- Regular contributions. If Amira had added £100 a month, the £8,200 end value would include her own deposits, and CAGR would wildly overstate performance. A money weighted measure such as XIRR, or a projection in our compound interest calculator, handles deposits properly.
- Negative start values. A company moving from a loss of $50,000 to a profit of $80,000 has no meaningful CAGR, because you cannot take a root of a negative ratio.
- Cherry picked dates. Starting the clock at a market low makes any fund look brilliant. Check CAGR over several windows before trusting a headline figure.
- Hidden risk. Two funds with the same 7% CAGR may have taken very different rides. CAGR says nothing about volatility.
Inflation is the other quiet distortion. A 7.32% CAGR during years when prices rose 3% a year is a real return of roughly 4.2%. To separate the two, compare it with a simple return on investment using our ROI calculator, then adjust for the inflation rate that applied in your country.
Key points
- CAGR equals the ending value divided by the starting value, raised to the power of 1 over the years, minus 1.
- £5,000 growing to £8,200 over 7 years is a CAGR of 7.32% a year.
- A simple average of yearly returns overstates growth whenever returns vary; Amira’s average was 7.84%.
- In Excel or Google Sheets, =RRI(years, start, end) returns CAGR directly.
- CAGR is unreliable when money is added or withdrawn, or when the start value is zero or negative.
Key CAGR Terms Explained
These are the building blocks you need when working out how to calculate CAGR for an investment, a business or any value that compounds.
- Starting value
- The value at the beginning of the period you are measuring, such as Amira’s £5,000 in January 2019. It must be above zero, because the CAGR formula divides by it and then takes a root of the ratio.
- Ending value
- The value at the end of the period, such as the £8,200 shown in January 2026. Dividing it by the starting value gives the growth multiple, which was 1.64 in Amira’s case, or 64% total growth.
- Number of years
- The time between the starting and ending values, written as a decimal when part years are involved. Seven annual statements after the first one mean 7 years, and 3 years and 6 months becomes 3.5 years.
- Geometric mean
- The average that suits values which multiply rather than add. CAGR is the geometric mean of the yearly growth factors minus one, which is why it came out at 7.32% while the plain average of Amira’s returns was 7.84%.
- RRI function
- A spreadsheet function in Excel and Google Sheets that returns the equivalent compound rate for an investment. Entered as RRI(7,5000,8200), it gives 0.0732, matching the power formula without any manual exponent.
Frequently Asked Questions
My fund doubled in 10 years. What CAGR is that?
A doubling over 10 years is a CAGR of 7.18% a year, because 2 raised to the power of 0.1 is 1.0718. The rule of 72 gives a close shortcut: 72 divided by 10 suggests about 7.2%.
Can CAGR be negative?
Yes, CAGR is negative whenever the ending value is lower than the starting value. £10,000 falling to £8,000 over 3 years gives 0.8 to the power of 1/3, minus 1, which is a CAGR of minus 7.17% a year.
Do I count the years or the data points?
Count the years between the first and last value, not the number of values. Annual figures for 2019, 2020 and so on up to 2026 are eight data points but only seven years of growth, so Amira divides by 7, not 8.
Is a 10% CAGR good for an investment?
A 10% CAGR sustained for many years is strong for a diversified share fund, but whether it is good depends on the risk taken, fees and inflation. Compare it with a low cost index fund over the same dates before judging.
Amira now quotes one number to her partner, 7.32% a year, and she knows it is lower than the average her app shows. Now that you know how to calculate CAGR by hand, try your own start and end values in the CAGR calculator, and remember to count years, not statements. Formula and examples checked October 2026.