Leah timed her cycle to work for a week: 12, 15, 11, 18 and 14 minutes. The average was easy, but her manager wanted to know how predictable the journey was before agreeing to a later start. Knowing how to find standard deviation answered that in five short steps, and the number it produced, 2.74 minutes, told the whole story.
This guide walks through those steps by hand, explains when to divide by n and when by n minus 1, and shows how to read the answer and get it from Excel, Google Sheets or a calculator.
Quick answer: To find standard deviation, work out the mean, subtract it from each value, square those differences and add them up. Divide the total by n minus 1 for a sample (or n for a whole population), then take the square root. For 12, 15, 11, 18 and 14 the mean is 14 and the sample standard deviation is 2.74.
In This Guide
How to find standard deviation step by step
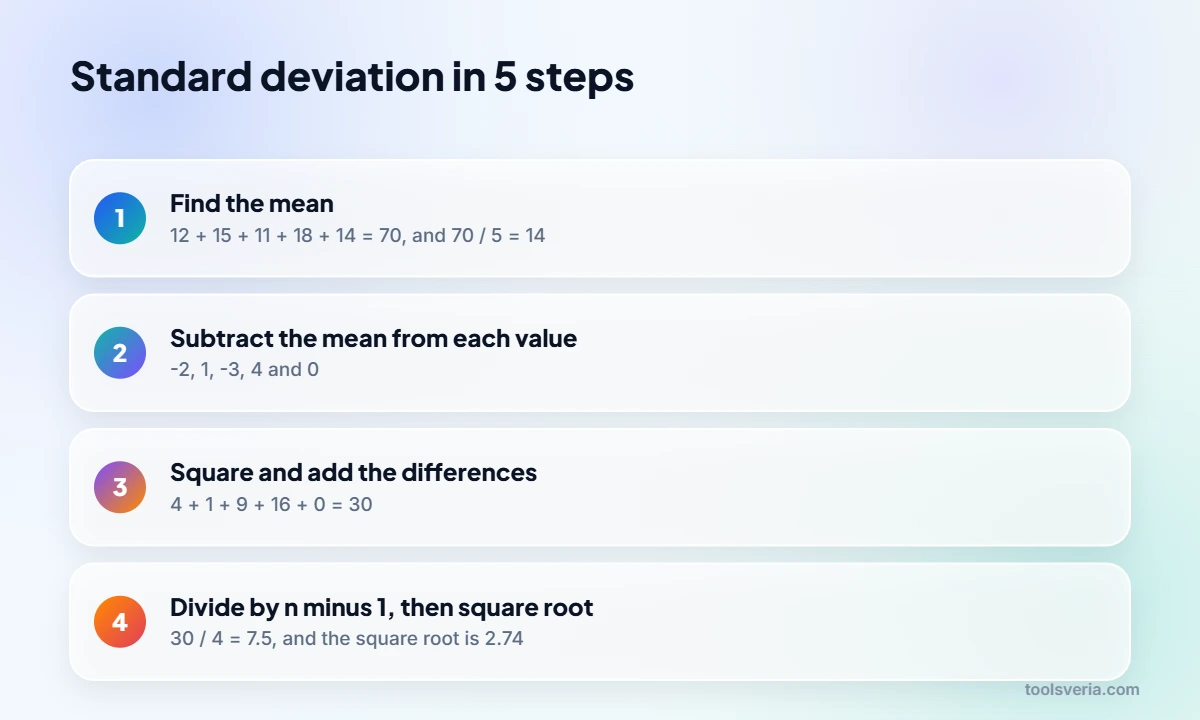
To find standard deviation by hand, follow five steps: find the mean, find each value’s distance from the mean, square those distances, average them (dividing by n minus 1 for a sample), and take the square root. Here is each step with Leah’s five commute times.
- Find the mean. 12 + 15 + 11 + 18 + 14 = 70, and 70 divided by 5 gives 14 minutes.
- Subtract the mean from each value. The deviations are -2, 1, -3, 4 and 0. They always add up to zero, which is a handy check.
- Square each deviation. That gives 4, 1, 9, 16 and 0, which removes the minus signs.
- Add the squares and divide. The sum of squares is 30. Leah’s week is a sample of all her journeys, so she divides by 5 minus 1 = 4, giving a variance of 7.5.
- Take the square root. The square root of 7.5 is 2.74, so the standard deviation is 2.74 minutes.
Squaring in step 3 matters for two reasons. It stops positive and negative deviations cancelling out, and it gives bigger weight to values far from the mean, so one very slow day pushes the answer up noticeably. If the final square root is awkward to do in your head, the square root calculator handles it to as many decimal places as you like.
What is the difference between sample and population standard deviation?
Sample standard deviation divides the sum of squares by n minus 1, while population standard deviation divides by n; use the sample version whenever your data is only part of a larger group you want to describe. Leah’s five days are a small slice of every journey she will ever make, so the sample formula is the right one.
| Feature | Sample standard deviation (s) | Population standard deviation (σ) |
|---|---|---|
| When to use it | Data is a subset, such as a survey or a week of readings | Data covers every member, such as all 30 pupils in one class |
| Divide the sum of squares by | n minus 1 | n |
| Leah’s variance | 30 / 4 = 7.5 | 30 / 5 = 6 |
| Leah’s standard deviation | 2.74 minutes | 2.45 minutes |
| Excel and Google Sheets | STDEV.S | STDEV.P |
| Calculator key | sx or σn-1 | σx or σn |
Dividing by n minus 1 is known as Bessel’s correction. A sample tends to sit a little closer to its own mean than the full population does, so dividing by a slightly smaller number nudges the estimate back up. The gap shrinks as the sample grows: with 100 values, dividing by 99 instead of 100 barely changes the result.

What does the standard deviation tell you?
Standard deviation tells you how far a typical value sits from the mean, in the same units as the data, so a small number means the values are tightly bunched and a large one means they are spread out. Leah’s 2.74 minutes says most of her rides land within about three minutes of 14.
Comparing data sets is where it shines. Imagine two bus routes that both average 14 minutes over five trips. Route A took 14, 14, 13, 15 and 14 minutes, a standard deviation of just 0.71. Route B took 8, 20, 10, 22 and 10 minutes, a standard deviation of 6.48. The averages are identical, yet only route A lets you leave the house at the last minute.
When data follows a bell shaped normal distribution, a rough rule applies: about 68% of values fall within one standard deviation of the mean, about 95% within two, and about 99.7% within three. If exam marks average 65 with a standard deviation of 10, roughly 68% of students scored between 55 and 75, and roughly 95% between 45 and 85. To place a single result on that scale, the z score calculator tells you how many standard deviations it sits from the mean.
A related measure, the coefficient of variation, divides the standard deviation by the mean. For Leah it is 2.74 / 14, about 19.6%, which lets you compare spread between data sets measured in different units.

How do you find standard deviation in Excel or on a calculator?
In Excel and Google Sheets, type =STDEV.S(A1:A5) for a sample or =STDEV.P(A1:A5) for a population, replacing A1:A5 with your own cell range. With Leah’s times in cells A1 to A5, STDEV.S returns 2.738613 and STDEV.P returns 2.449490.
On a scientific calculator, switch to statistics mode (often labelled SD or STAT), enter each value, then recall the standard deviation. Most models show two results: one marked sx or σn-1 for a sample, and one marked σx or σn for a population. Graphing calculators such as the TI-84 list both after running 1-Var Stats.
In Python, statistics.stdev() gives the sample result and statistics.pstdev() the population one. Whatever tool you use, it is worth checking a small set by hand once, as we did above, so you know which version your software reports. Our standard deviation calculator with working shown displays both side by side with every step shown, and the average calculator gives the mean on its own when that is all you need.
What are the most common standard deviation mistakes?
The most common mistake is dividing by n when the data is a sample, which understates the spread; with Leah’s data it gives 2.45 instead of 2.74. Watch for these too:
- Forgetting the square root and reporting the variance (7.5) as the standard deviation.
- Squaring the sum of deviations instead of summing the squared deviations. The deviations add to zero, so that route always gives nothing useful.
- Rounding the mean too early. With a mean like 14.333, keep at least three decimal places until the last step.
- Mixing units. If some times are in seconds and others in minutes, convert first.
- Treating standard deviation as a range. It describes typical distance from the mean, not the gap between the smallest and largest values.
Key points
- Standard deviation measures how far typical values sit from the mean, in the data’s own units.
- The method is mean, deviations, squares, divide, square root.
- Divide by n minus 1 for a sample and by n for a whole population.
- Leah’s times of 12, 15, 11, 18 and 14 minutes give a sample standard deviation of 2.74 minutes.
- In Excel use STDEV.S for samples and STDEV.P for populations.
Key Standard Deviation Terms Explained
These are the building blocks you need once you know how to find standard deviation, from the mean to the n minus 1 correction.
- Mean
- The mean is the sum of all values divided by how many values there are. Leah’s five commute times add up to 70 minutes, so the mean is 14 minutes, the centre every deviation is measured from.
- Deviation
- A deviation is the distance of one value from the mean, kept with its sign. Leah’s 18 minute journey has a deviation of 4, and her 11 minute journey has a deviation of minus 3.
- Variance
- Variance is the average of the squared deviations, so it is measured in squared units. For Leah’s data the sum of squares is 30, giving a sample variance of 7.5 and a population variance of 6.
- Bessel’s correction
- Bessel’s correction is the switch from dividing by n to dividing by n minus 1 when the data is a sample. It slightly enlarges the result so it better estimates the spread of the whole population.
- Normal distribution
- A normal distribution is the symmetric bell shaped pattern many measurements follow. In it, about 68% of values sit within one standard deviation of the mean, 95% within two and 99.7% within three.
Frequently Asked Questions
My teacher divided by n but my textbook uses n minus 1. Who is right?
Both, for different situations. Dividing by n gives the population standard deviation, used when you have every value in the group. Dividing by n minus 1 gives the sample version, used when the data is a subset. Leah’s commute data gives 2.45 and 2.74 respectively.
Can a standard deviation ever be negative?
No. It is the square root of an average of squared numbers, so it is always zero or positive. A result of exactly zero means every value is identical, such as five commutes that all took 14 minutes.
Is a standard deviation of 2.74 high or low?
It depends on the mean and the context. Against a 14 minute average it represents about 19.6% variation, which is moderate for a commute. Compare it with similar data, such as bus route A at 0.71 minutes, rather than judging the number alone.
Why do we square the differences instead of just averaging them?
The raw deviations always sum to zero, because values above and below the mean cancel out. Squaring makes every deviation positive and weights larger gaps more heavily. Taking the square root at the end returns the answer to the original units.
How many values do I need for a meaningful standard deviation?
You can calculate it from two values, but small samples give unstable answers. Five readings, like Leah’s week, give a rough picture; 30 or more give a far steadier estimate, and the gap between dividing by n and n minus 1 becomes tiny.
What is the difference between variance and standard deviation?
Variance is the standard deviation squared, so it is in squared units. Leah’s sample variance is 7.5 square minutes, which is hard to picture, while the standard deviation of 2.74 minutes is in the same units as her data and easy to interpret.
Leah’s manager agreed to the later start once he saw that her journeys rarely strayed more than three minutes from the average. Try the five steps on your own numbers, then check them with the calculator. Method checked October 2026.