Welch, Student, paired and one sample t-tests with the full working shown.
Separate values with commas, spaces or new lines.
| Step by step working | Result |
|---|
Assumes independent observations and roughly normal data (or differences). Welch is the safer default for two groups. Your data never leaves this page.
This t-test calculator helps students, researchers and analysts decide whether two means really differ, using Welch, Student, paired or one sample tests on raw data or summary statistics. It follows the standard Student's t-test formulas and prints every step, so you can check the arithmetic against your notes. Formulas checked October 2026.
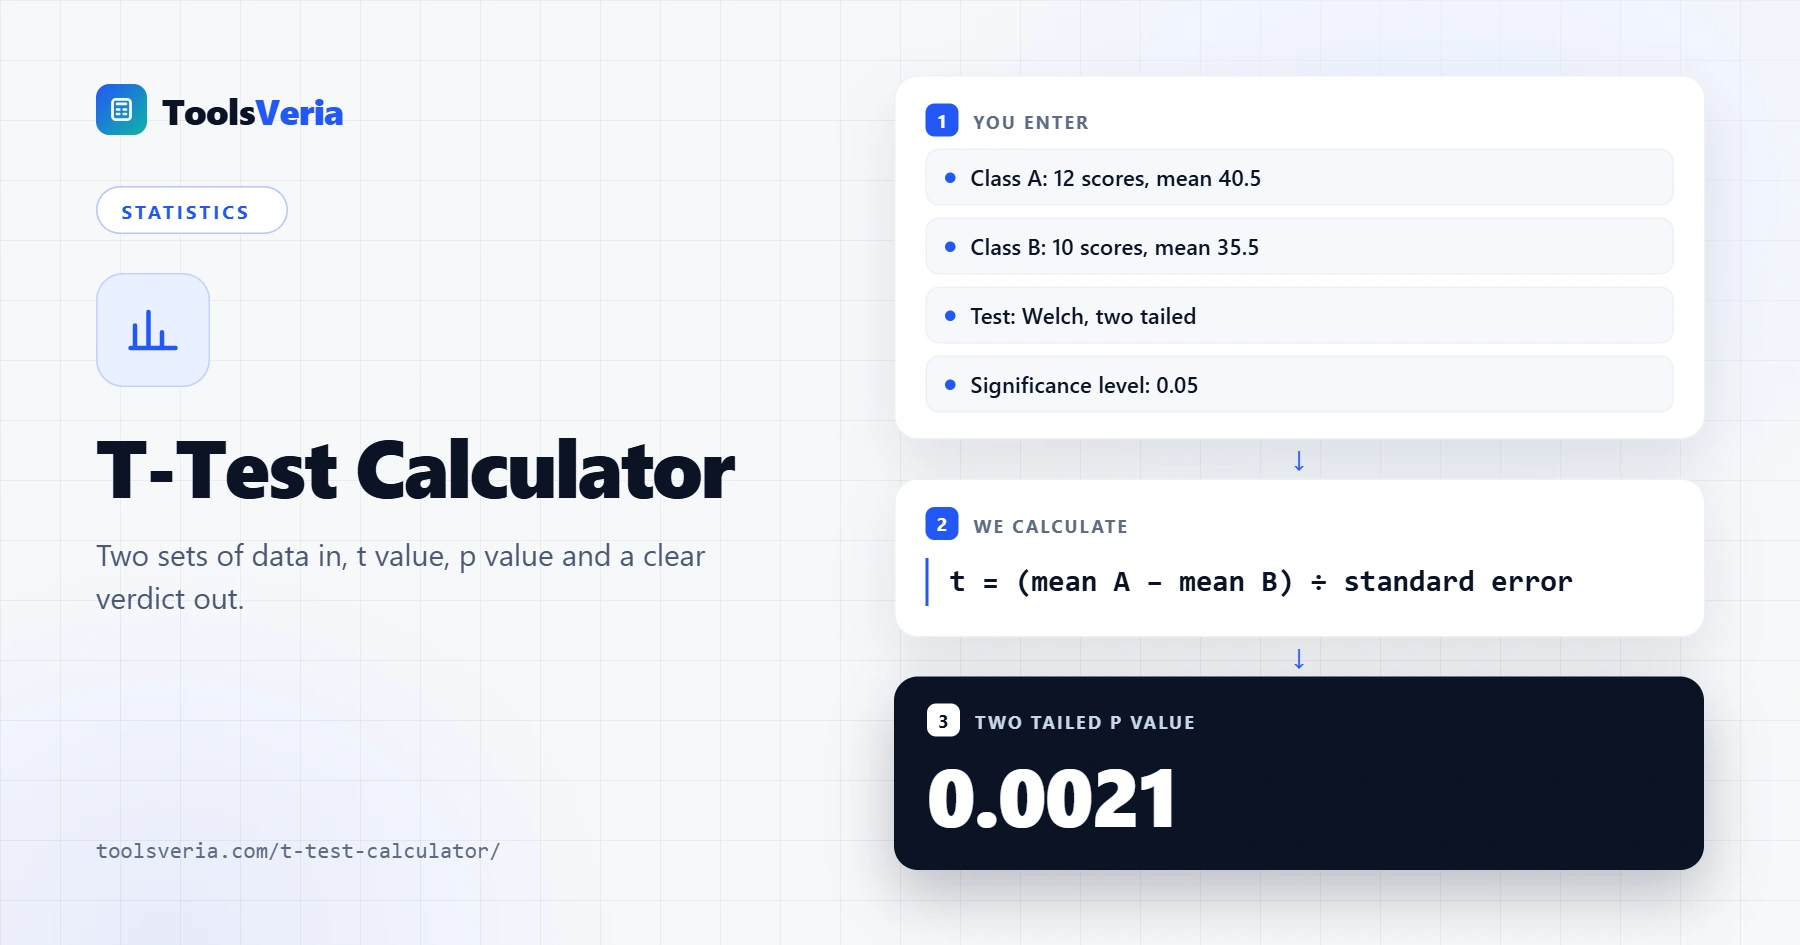
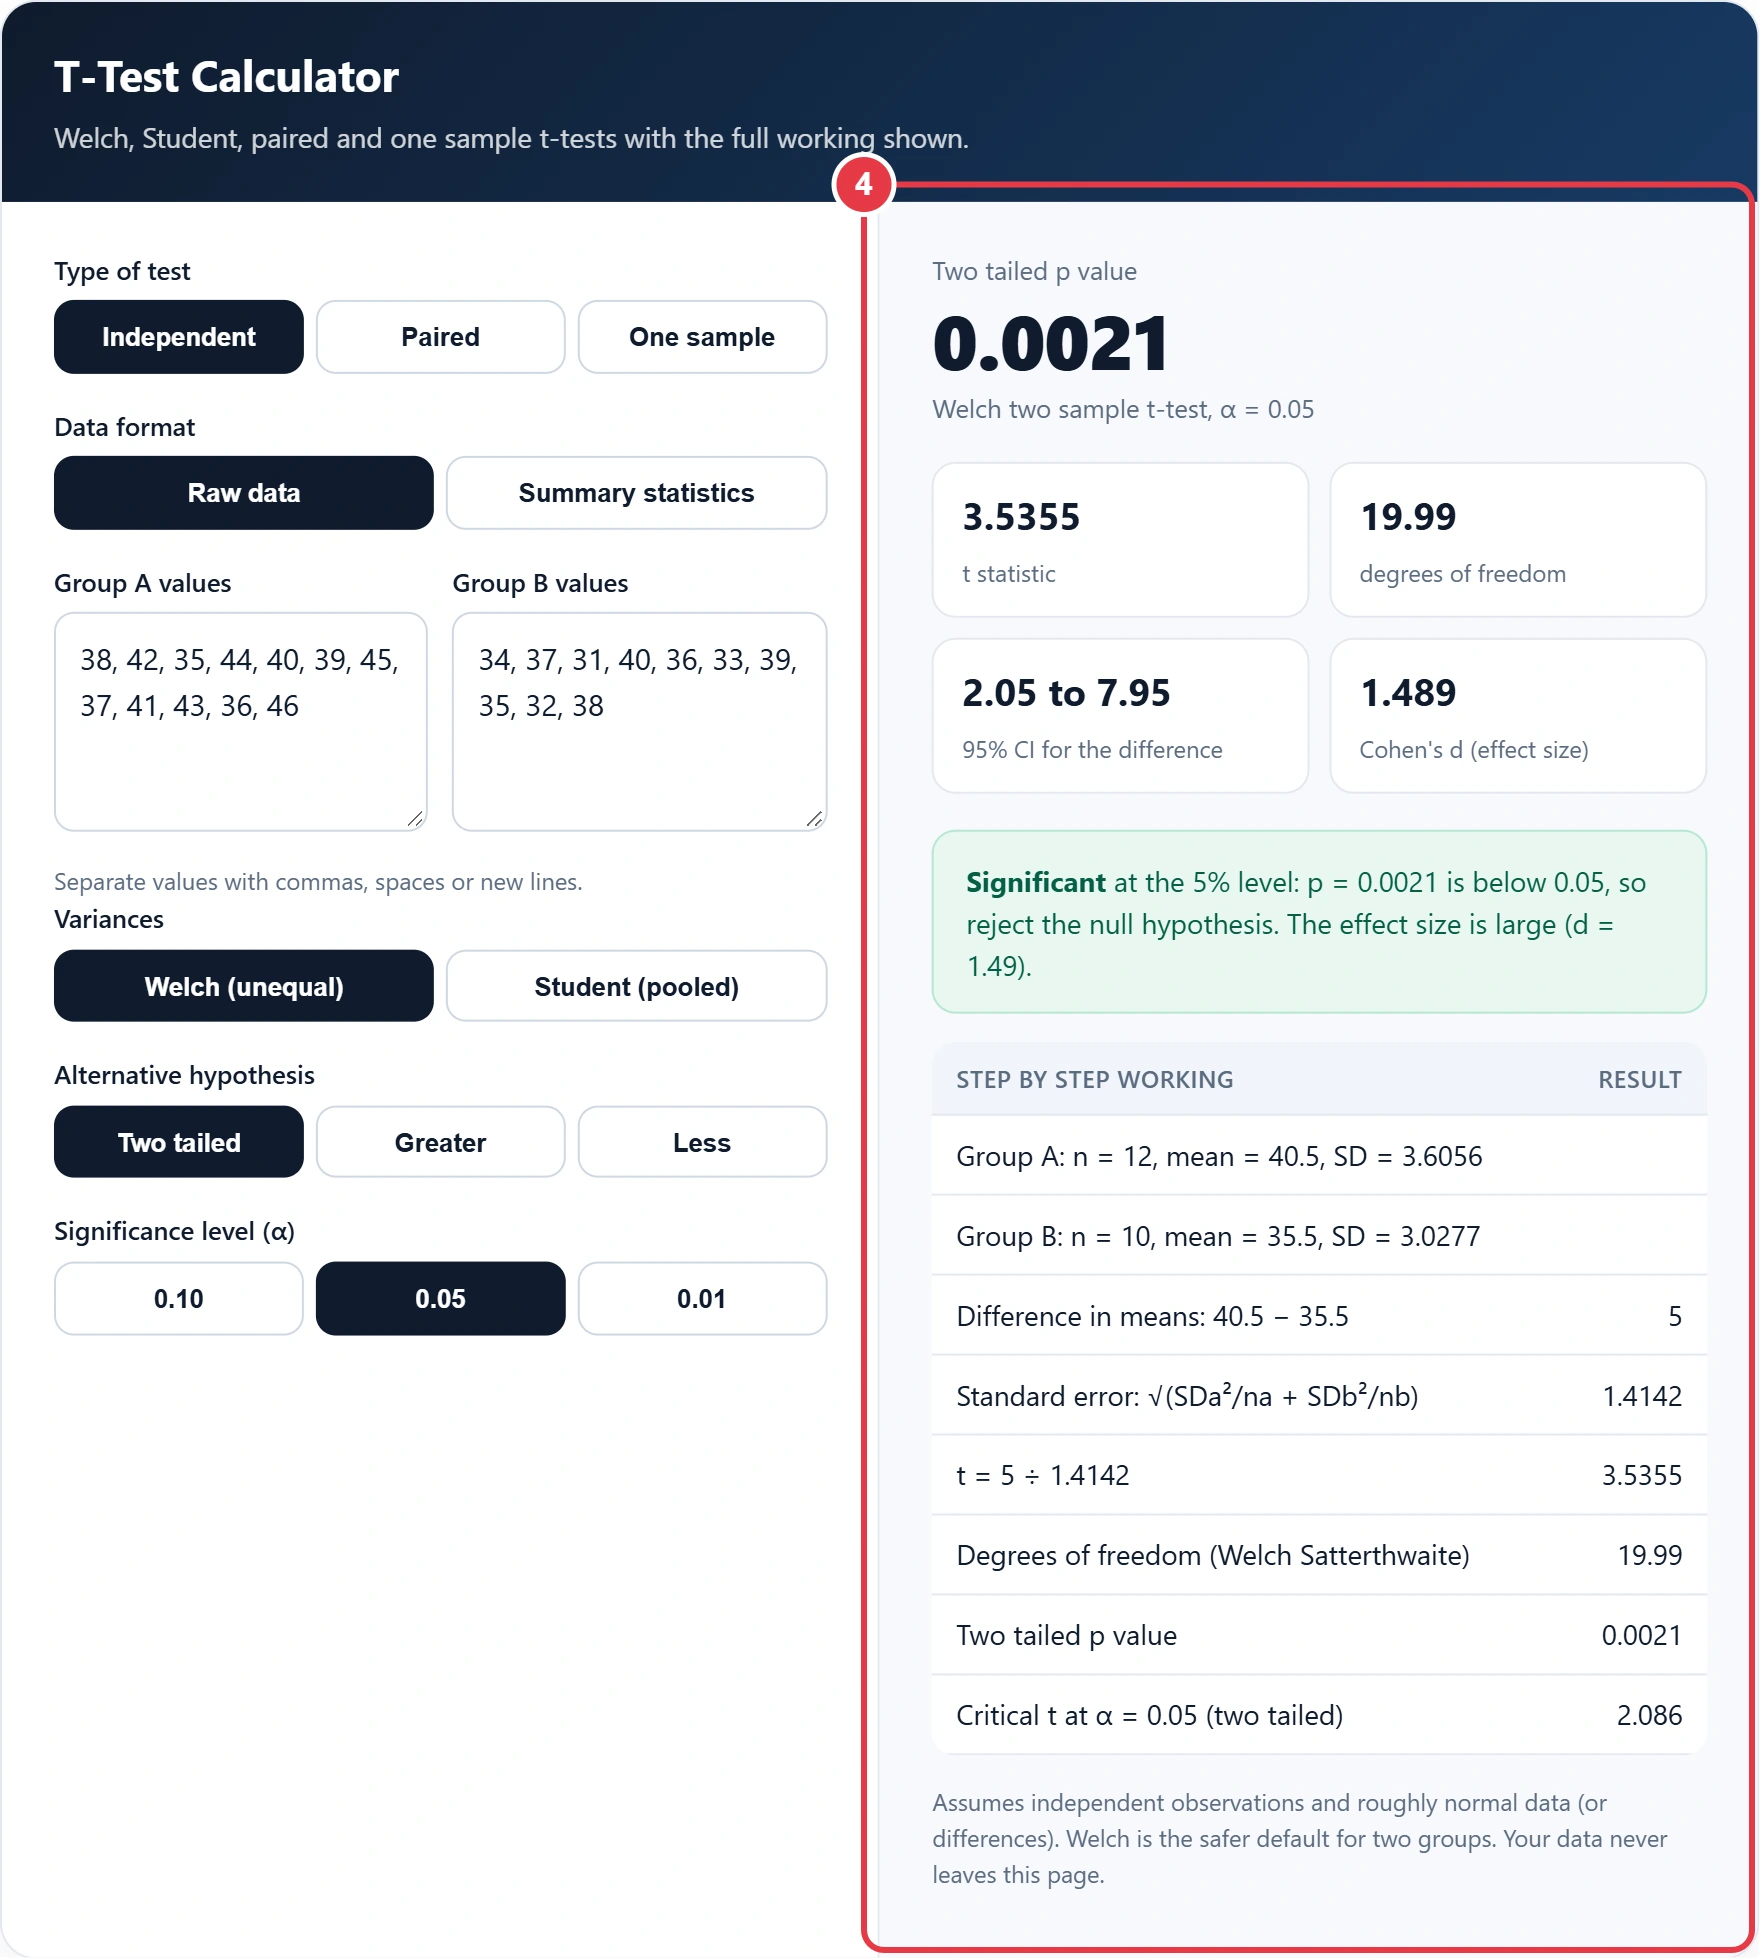
Quick answer: a t-test divides the difference between two means by its standard error. With the defaults loaded in this t-test calculator, Class A averages 40.5 and Class B 35.5, the standard error is 1.414, so t = 3.536 on 19.99 degrees of freedom and p = 0.0021, which is significant at 0.05.
In This Guide
What Is a T-Test?
A t-test is a hypothesis test that checks whether a mean, or a difference between two means, is larger than random sampling variation would explain. In words, the formula is: the observed difference, divided by the standard error of that difference, gives t. The bigger t is, the less likely the gap is down to chance.
The t value is then compared with a t distribution whose shape depends on the degrees of freedom, roughly the sample size minus the number of means estimated. That comparison gives the p value: the probability of a t at least this extreme if the null hypothesis (no real difference) were true.
How to Use the T-Test Calculator
Step 1: Choose the Test and Data Format
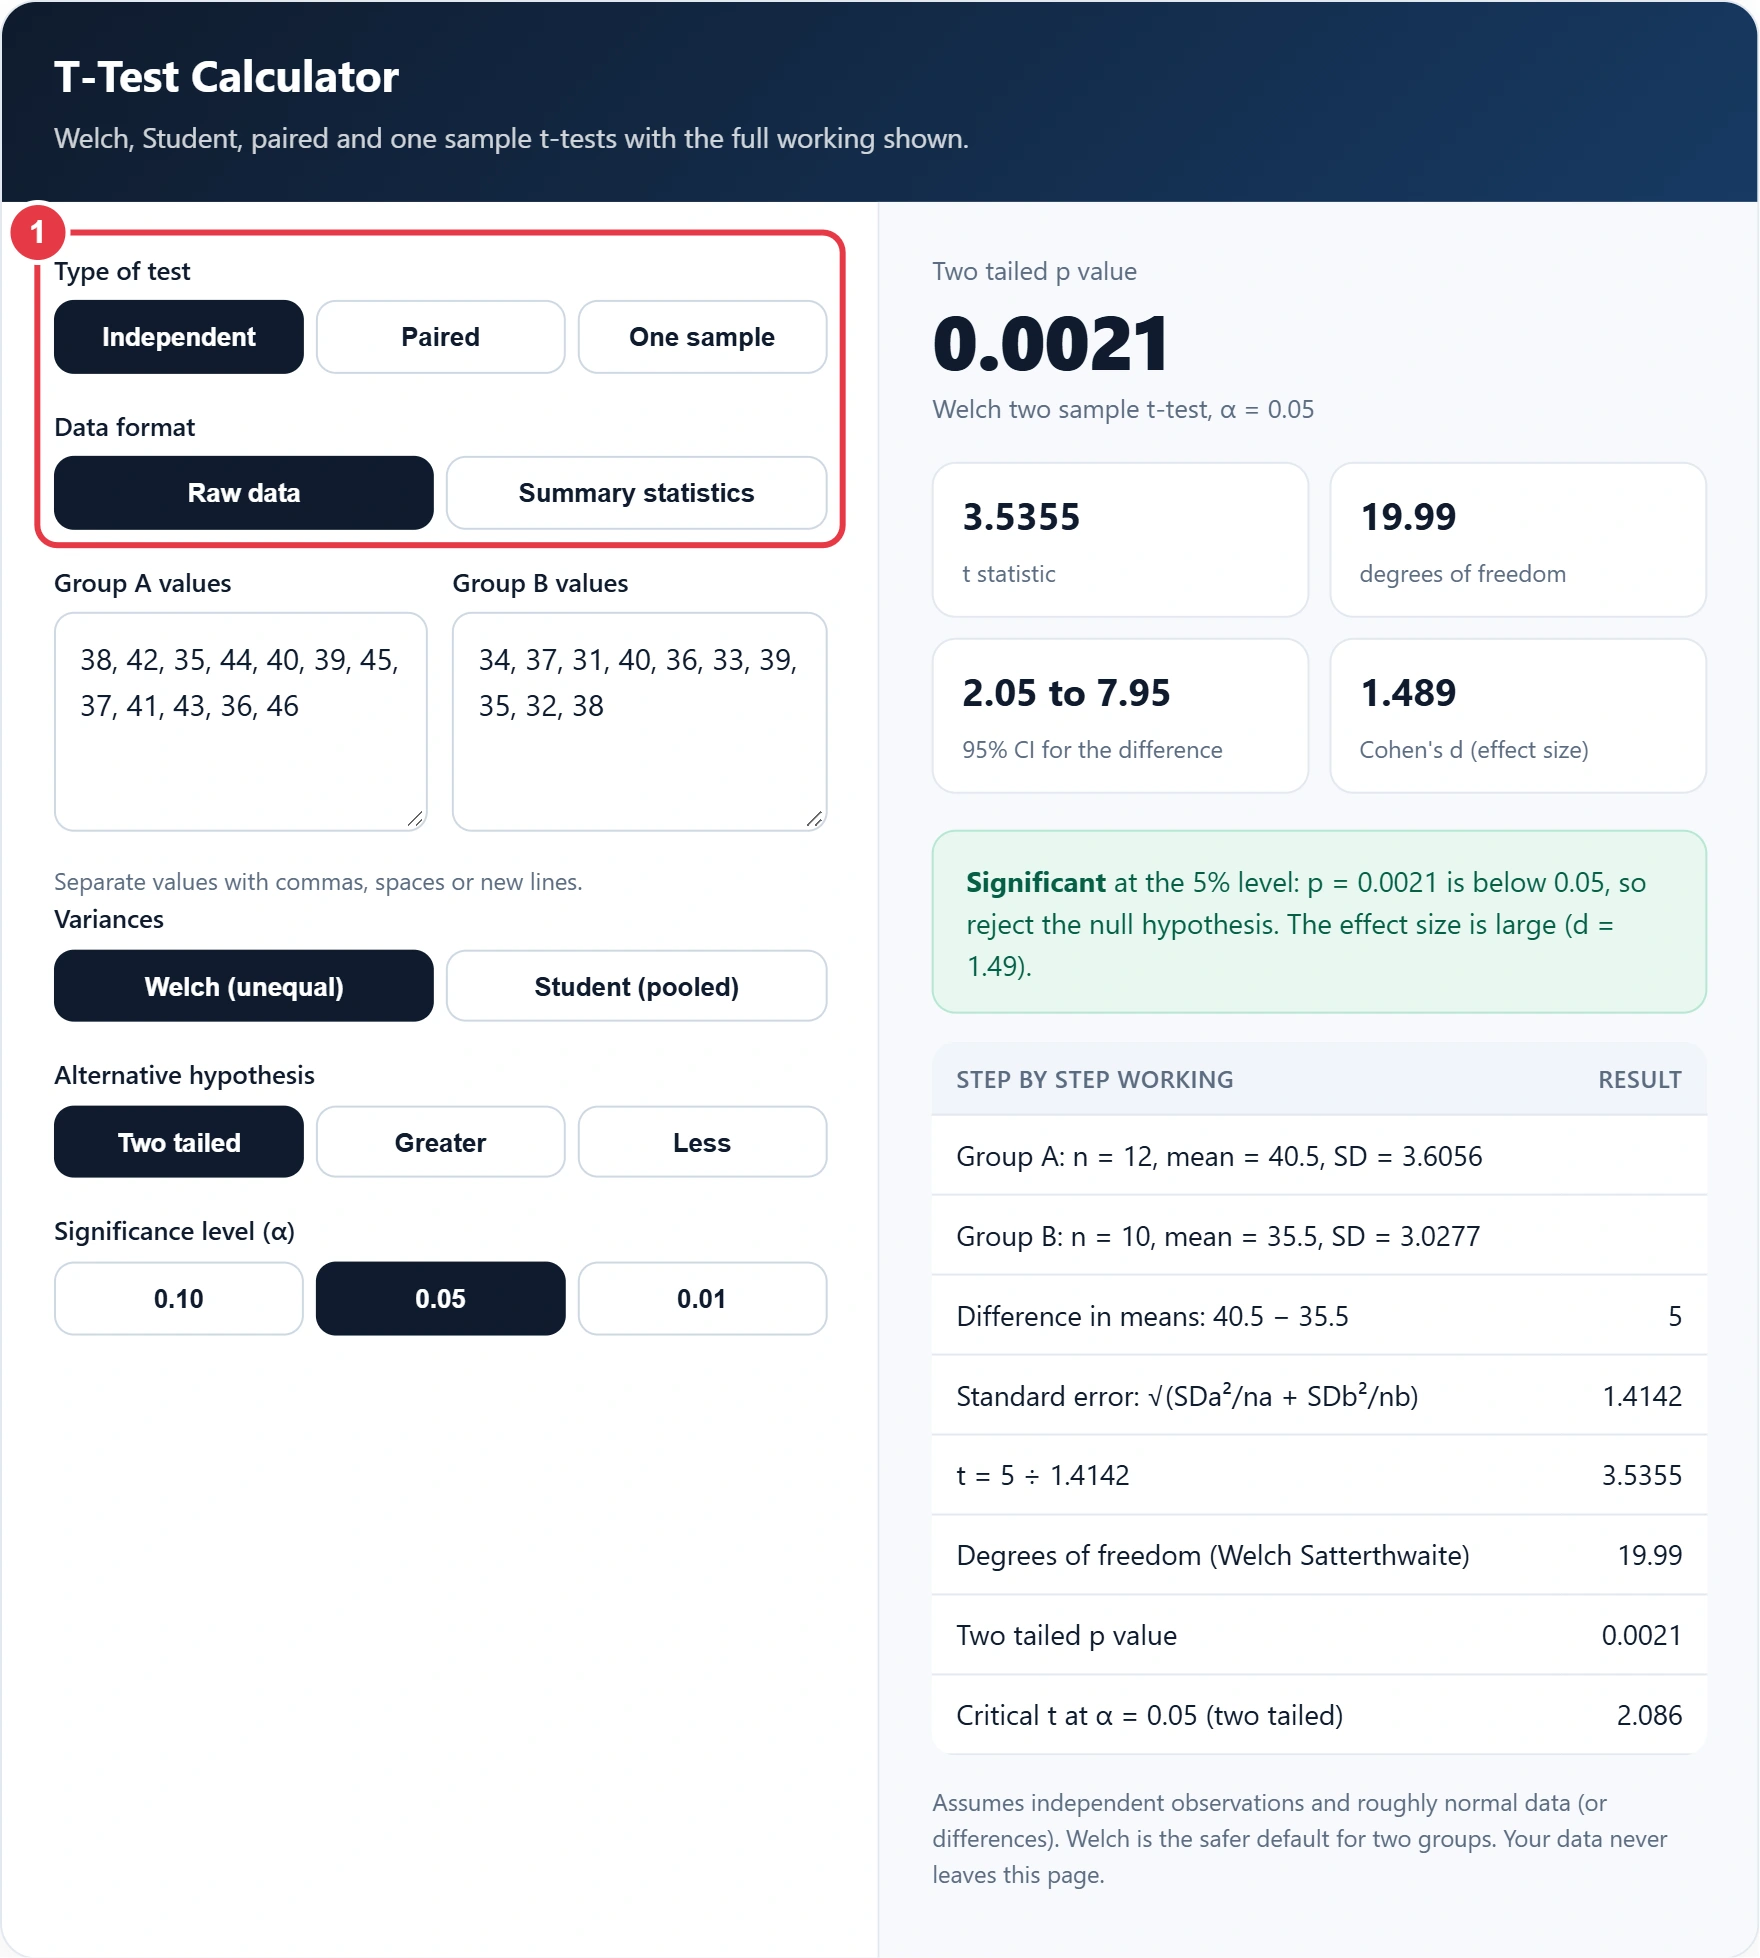
Pick Independent for two separate groups of people or things, Paired for the same subjects measured twice, or One sample to test a single mean against a target value. Choose Raw data to paste numbers, or Summary statistics if you only have each mean, standard deviation and sample size.
Step 2: Enter Your Data
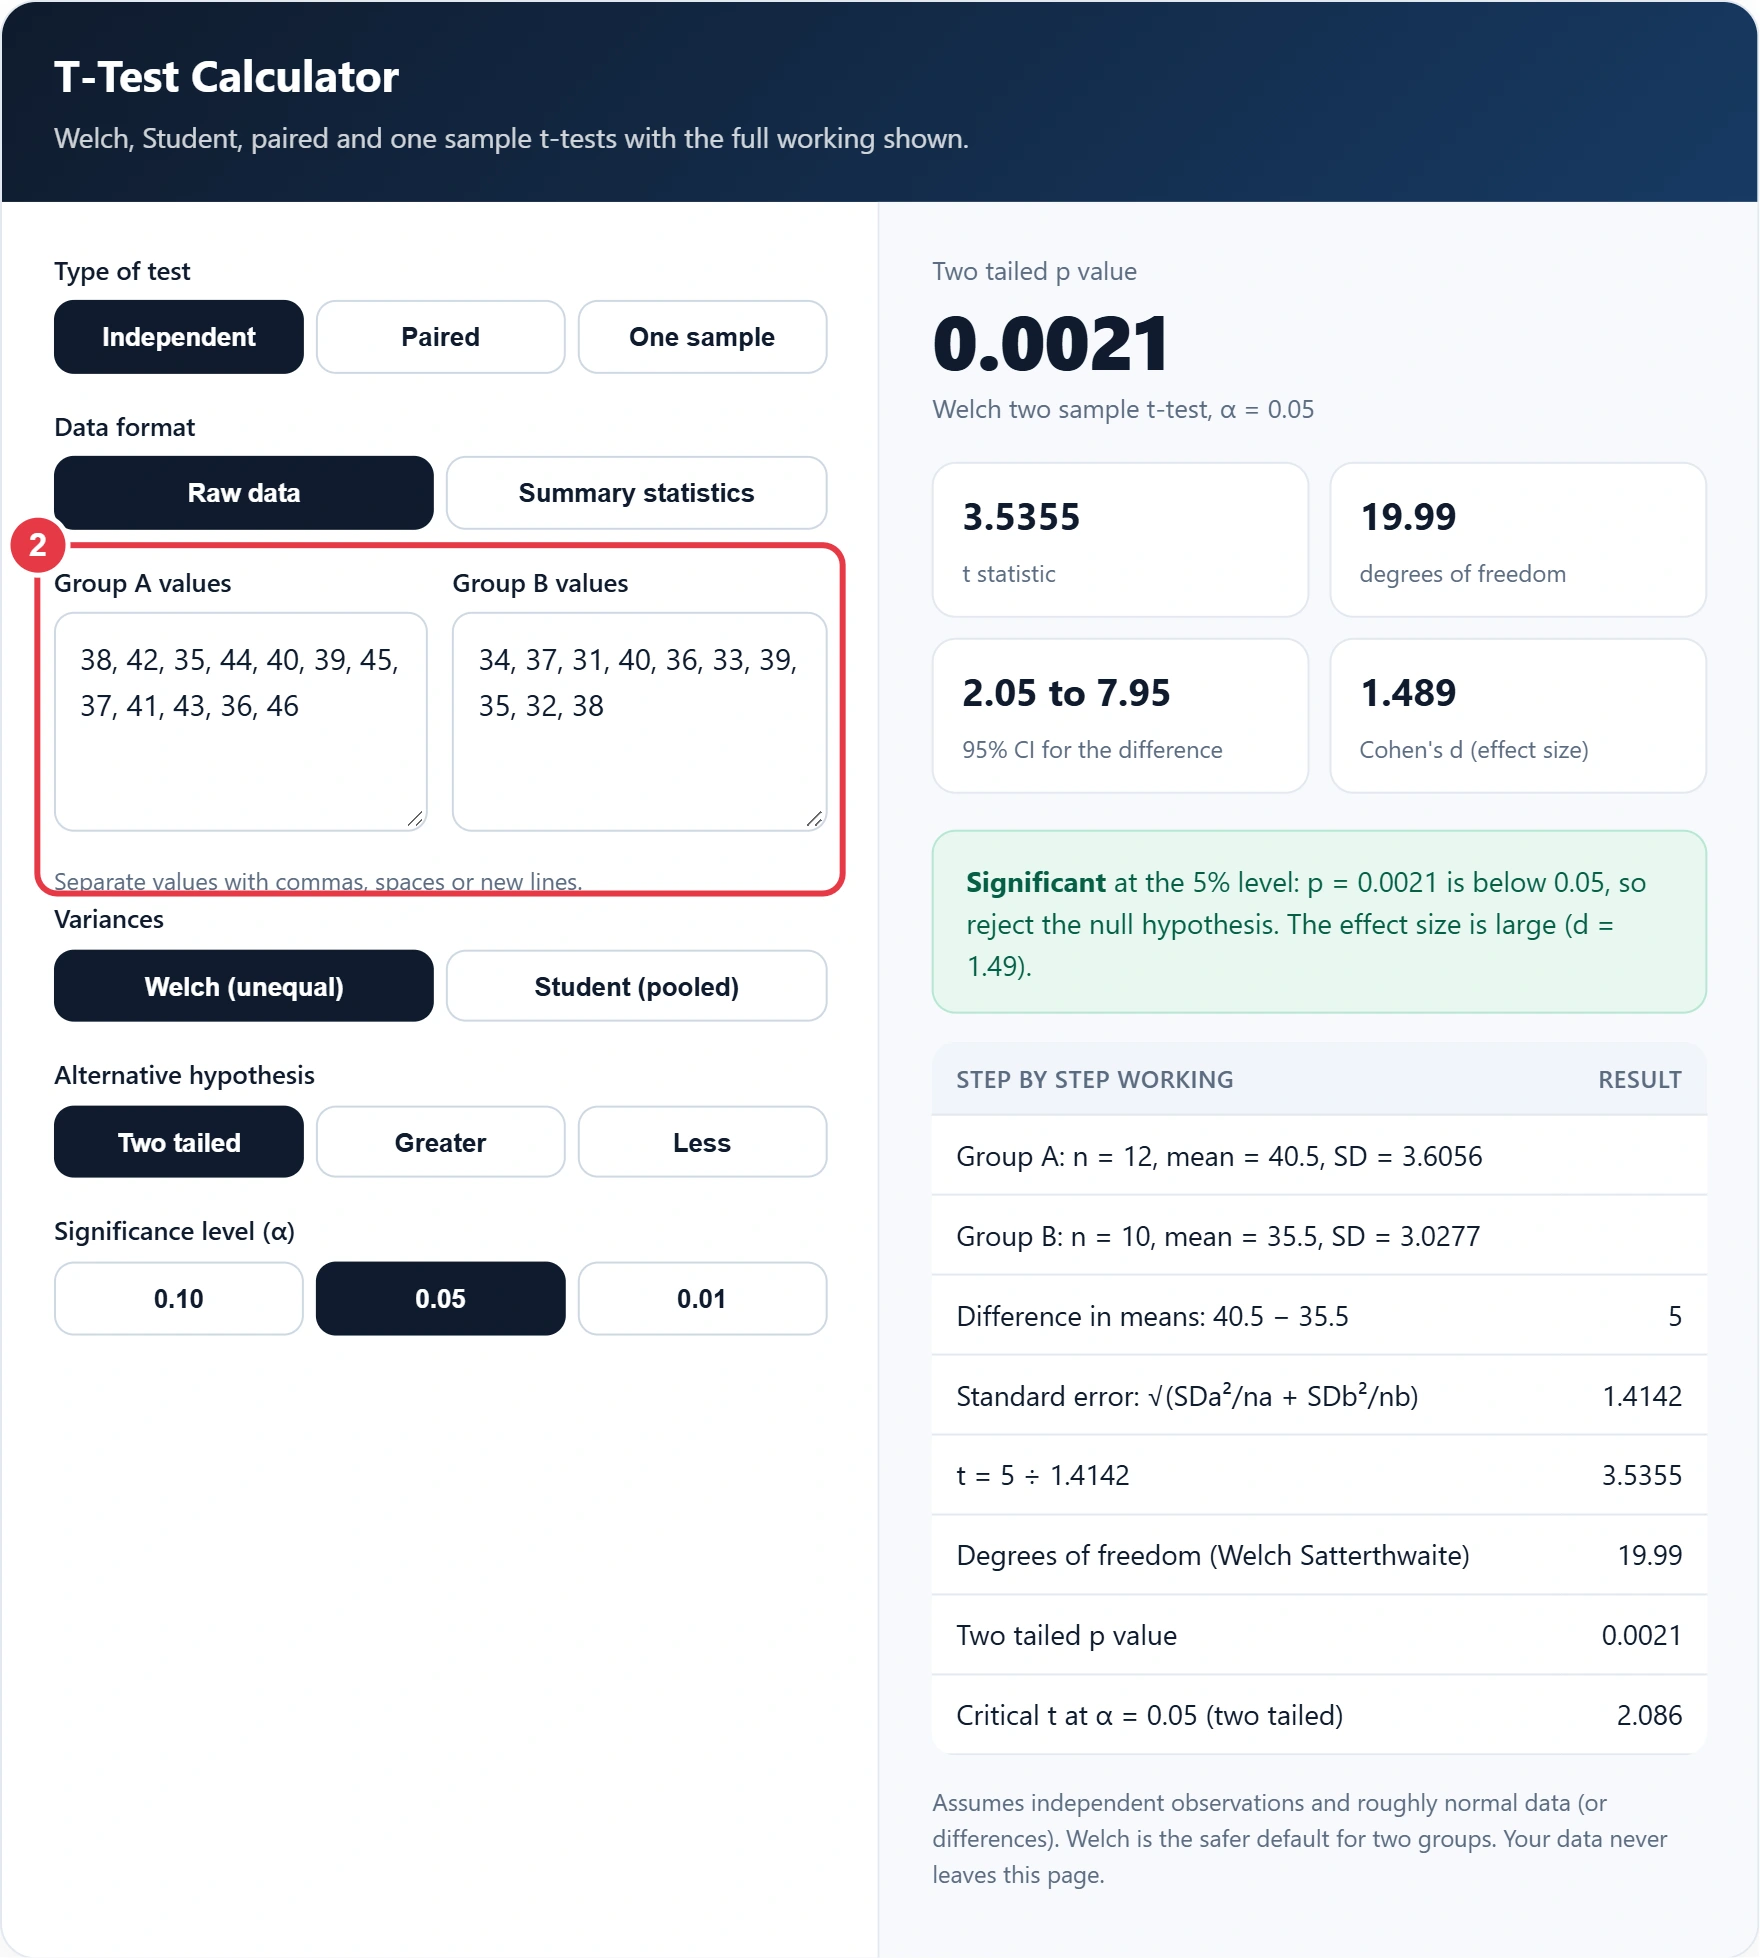
In the t-test calculator, paste values separated by commas, spaces or line breaks, straight from a spreadsheet column if you like. For paired data, keep both columns in the same order so each before value lines up with its after value. If you only need the mean of a list, the average calculator also returns the median and mode, which helps you spot skewed data first.
Step 3: Set Variances, Tails and Alpha
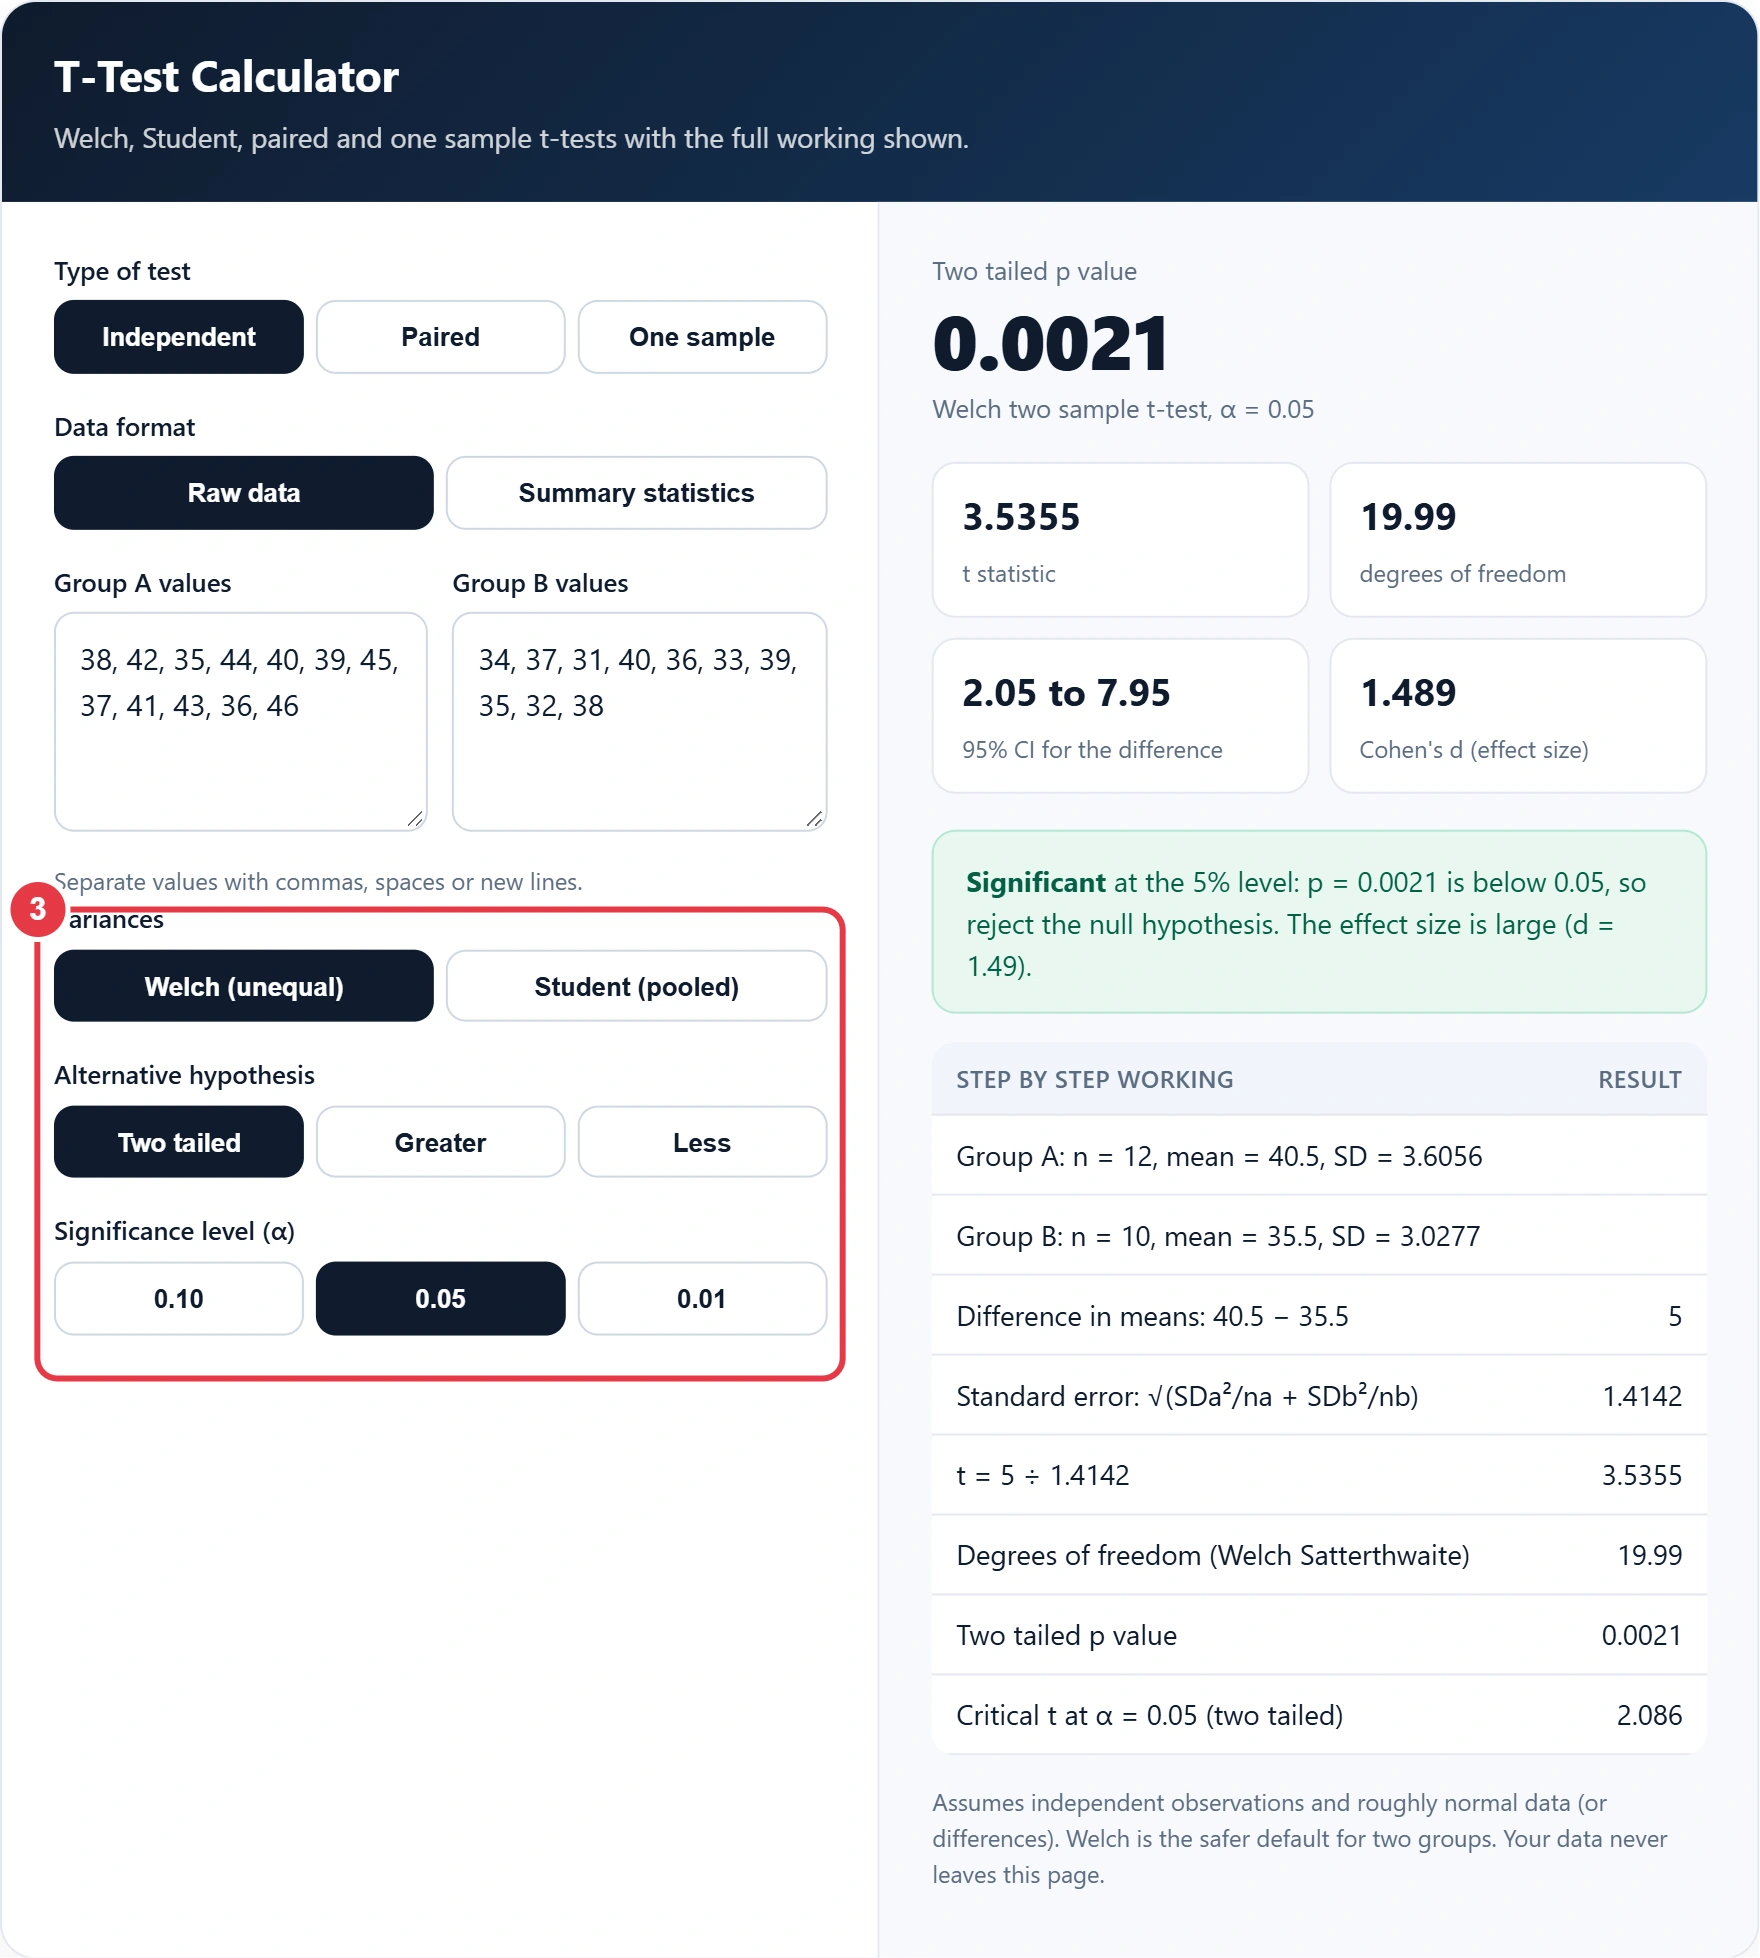
Leave Welch selected unless you have a good reason to assume equal variances. Choose Two tailed when any difference matters, or Greater or Less when your hypothesis states a direction before you see the data. Then pick α, usually 0.05.
Step 4: Read the Result and Working
The t-test calculator shows the p value, t, degrees of freedom, a confidence interval for the difference and Cohen's d. The verdict box states whether to reject the null hypothesis, and the working table lists every intermediate number for your write up.
Which T-Test Should I Use?
Use Welch's test for two separate groups, a paired test when the same subjects are measured twice, and a one sample test to compare one mean with a fixed value. In this t-test calculator, Student's pooled test is only worth choosing when both groups have similar standard deviations and similar sizes.
| Test | Use it when | Standard error | Degrees of freedom |
|---|---|---|---|
| Welch two sample | Two independent groups (default) | √(s1²/n1 + s2²/n2) | Welch Satterthwaite formula |
| Student two sample | Two independent groups, equal variances | pooled SD × √(1/n1 + 1/n2) | n1 + n2 − 2 |
| Paired | Same subjects before and after | SD of differences ÷ √n | pairs − 1 |
| One sample | One mean against a target | SD ÷ √n | n − 1 |
Many statisticians now treat Welch as the default because it stays accurate when the variances differ, as explained in the article on Welch's t-test, and loses very little when they are equal. With strongly skewed data or very small samples, a Mann Whitney or Wilcoxon test is a sensible alternative.
How Do You Calculate a T-Test by Hand?
Subtract the two means, divide by the standard error, then look up the p value for that t on the right degrees of freedom. Here is the example loaded in the tool.
Priya teaches two Year 10 maths classes. Class A (12 pupils) used a new revision app and averaged 40.5 out of 50 with an SD of 3.606; Class B (10 pupils) revised as usual and averaged 35.5 with an SD of 3.028. The variances are 13.0 and 9.17, so the Welch standard error is √(13.0/12 + 9.17/10) = √2.0 = 1.414. That gives t = 5 ÷ 1.414 = 3.536 with 19.99 degrees of freedom, and a two tailed p value of 0.0021. The 95% confidence interval for the gap runs from 2.05 to 7.95 marks, and Cohen's d is 1.49, a large effect.
Switch to Student and t becomes 3.478 on 20 degrees of freedom with p = 0.0024: the same conclusion, because the two SDs are close. To express the 5 mark gain as a percentage of Class B's score, the percentage difference calculator does it in one step, which is often clearer for a parents' evening than a t value.
What Does the P Value Mean in a T-Test?
The p value is the chance of seeing a difference at least as large as yours if the true means were equal; below 0.05 is the usual cut off for significance. It is not the probability that your hypothesis is true, and a tiny p value with a tiny effect size can still be practically unimportant.
That is why the calculator reports the confidence interval and Cohen's d alongside p. As a rough guide, d around 0.2 is small, 0.5 medium and 0.8 or more large. If you are comparing conversion rates rather than averages, the A/B testing significance calculator is the right tool, because proportions need a z test instead of a t-test.
What Are the Assumptions of a T-Test?
A t-test assumes independent observations, data measured on a continuous scale, and roughly normal values in each group (or normal differences for a paired test). Student's version also assumes equal variances. With 30 or more values per group the test copes well with moderate skew, but outliers can still distort the mean, so check your data before you trust any t-test calculator result.
T-Test Calculator Terms You Should Know
These definitions explain the statistical concepts behind the t-test calculator so you can choose the right test and interpret its output with confidence.
- Null hypothesis
- The default assumption that there is no real difference or effect, for example that two group means are equal. A t-test measures how surprising the observed data would be if this assumption were actually true.
- p value
- The probability of a test statistic at least as extreme as the observed one, calculated on the assumption that the null hypothesis holds. A small value signals poor fit with no difference, yet it says nothing about how large the effect is.
- Welch's t-test
- A version of the two sample t-test that does not assume both groups share the same variance, adjusting the degrees of freedom to compensate. It performs well whether or not the variances match, so it rarely leads analysts astray.
- Standard error
- The estimated standard deviation of a sample statistic, such as a mean or a difference between means, across repeated samples. It shrinks as sample sizes grow, which is why larger studies can detect smaller differences.
- Degrees of freedom
- The number of independent values free to vary when estimating a statistic. In a t-test it sets the shape of the t distribution, which has heavier tails when it is small and approaches the normal distribution as it grows.
- Cohen's d
- A standardised effect size equal to the difference between two means divided by a pooled standard deviation. It describes how large a difference is in practical terms, complementing the p value, which only addresses statistical significance.
</>Embed this calculator on your website
Add the free T-Test Calculator to your own site or blog. Copy the code below and paste it into an HTML block. It resizes itself and works on phones.
How we checked this tool: the Tools Veria Editorial Team built this tool by hand, checked it against the official rules or published standards where they apply, and tested it against worked examples. Results are estimates for planning, not personal financial or tax advice. Read our editorial policy and disclaimer, or report an error.
Frequently Asked Questions
What is the difference between Welch and Student t-tests?
Welch's t-test does not assume the two groups have equal variances and adjusts the degrees of freedom to match, while Student's test pools the variances. Welch is the safer default because it stays accurate when spreads differ and loses almost nothing when they are equal.
When should I use a paired t-test?
Use a paired t-test when each value in one column belongs to the same subject as a value in the other, such as 8 runners timed before and after a training plan. The test analyses the differences, which removes person to person variation and usually gives more power.
What p value is significant in a t-test?
A p value below 0.05 is the usual threshold, meaning a difference this large would appear less than 5% of the time if the means were truly equal. Stricter work uses 0.01, while exploratory studies sometimes accept 0.10.
How do I calculate degrees of freedom for a t-test?
For a one sample or paired test, degrees of freedom equal n minus 1. For Student's two sample test they equal n1 + n2 minus 2. Welch's test uses the Welch Satterthwaite formula, which gives 19.99 for samples of 12 and 10 in the example.
Should I use a one tailed or two tailed t-test?
Use two tailed unless you stated the direction of the effect before collecting data and a result in the other direction would be meaningless. A one tailed p value is half the two tailed value when the effect goes the predicted way, so choosing it after seeing the data is misleading.
Can I run a t-test with only summary statistics?
Yes. Choose Summary statistics and enter each group's mean, standard deviation and sample size. For example, means of 40.5 and 35.5 with SDs of 3.606 and 3.028 and sizes 12 and 10 give t = 3.536 and p = 0.0021 with Welch's test.