See how a new purchase changes your average cost per share.
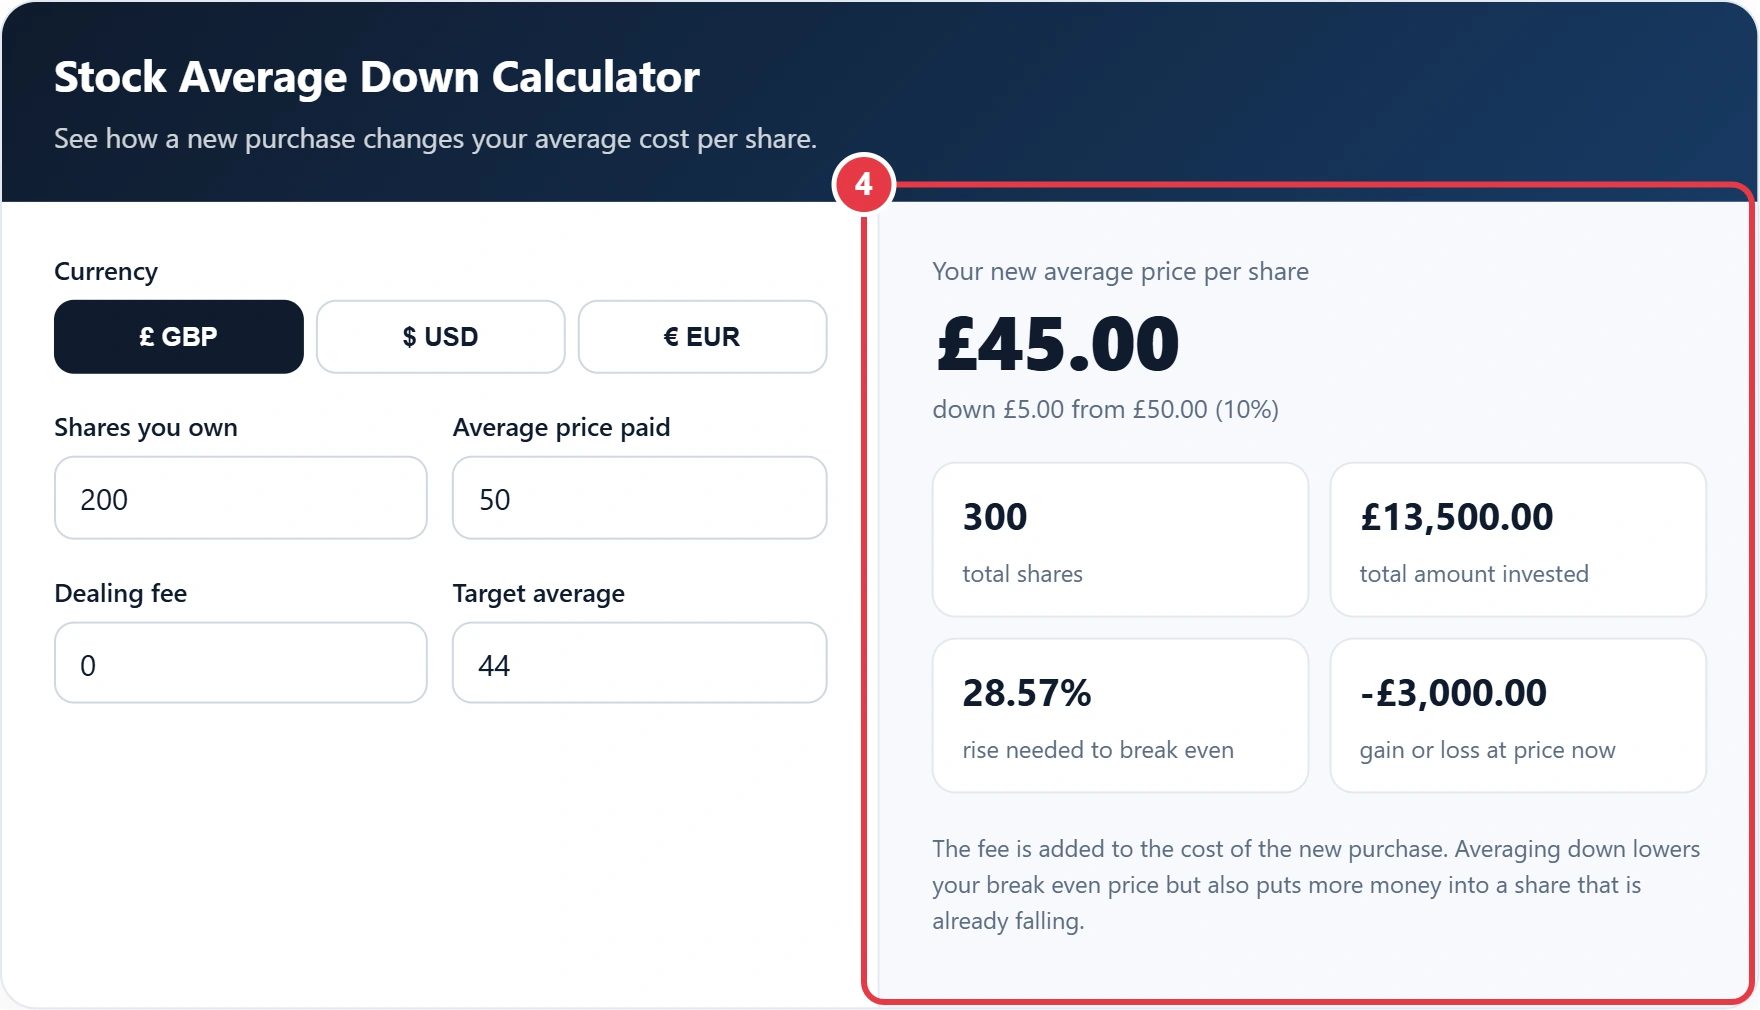
The fee is added to the cost of the new purchase. Averaging down lowers your break even price but also puts more money into a share that is already falling.
When a share you hold drops, buying more at the lower price pulls your average cost down. This stock average down calculator shows the new average straight away, how far the price must climb for you to break even, and how many extra shares it would take to hit an average you choose, so the decision rests on numbers rather than a hunch.
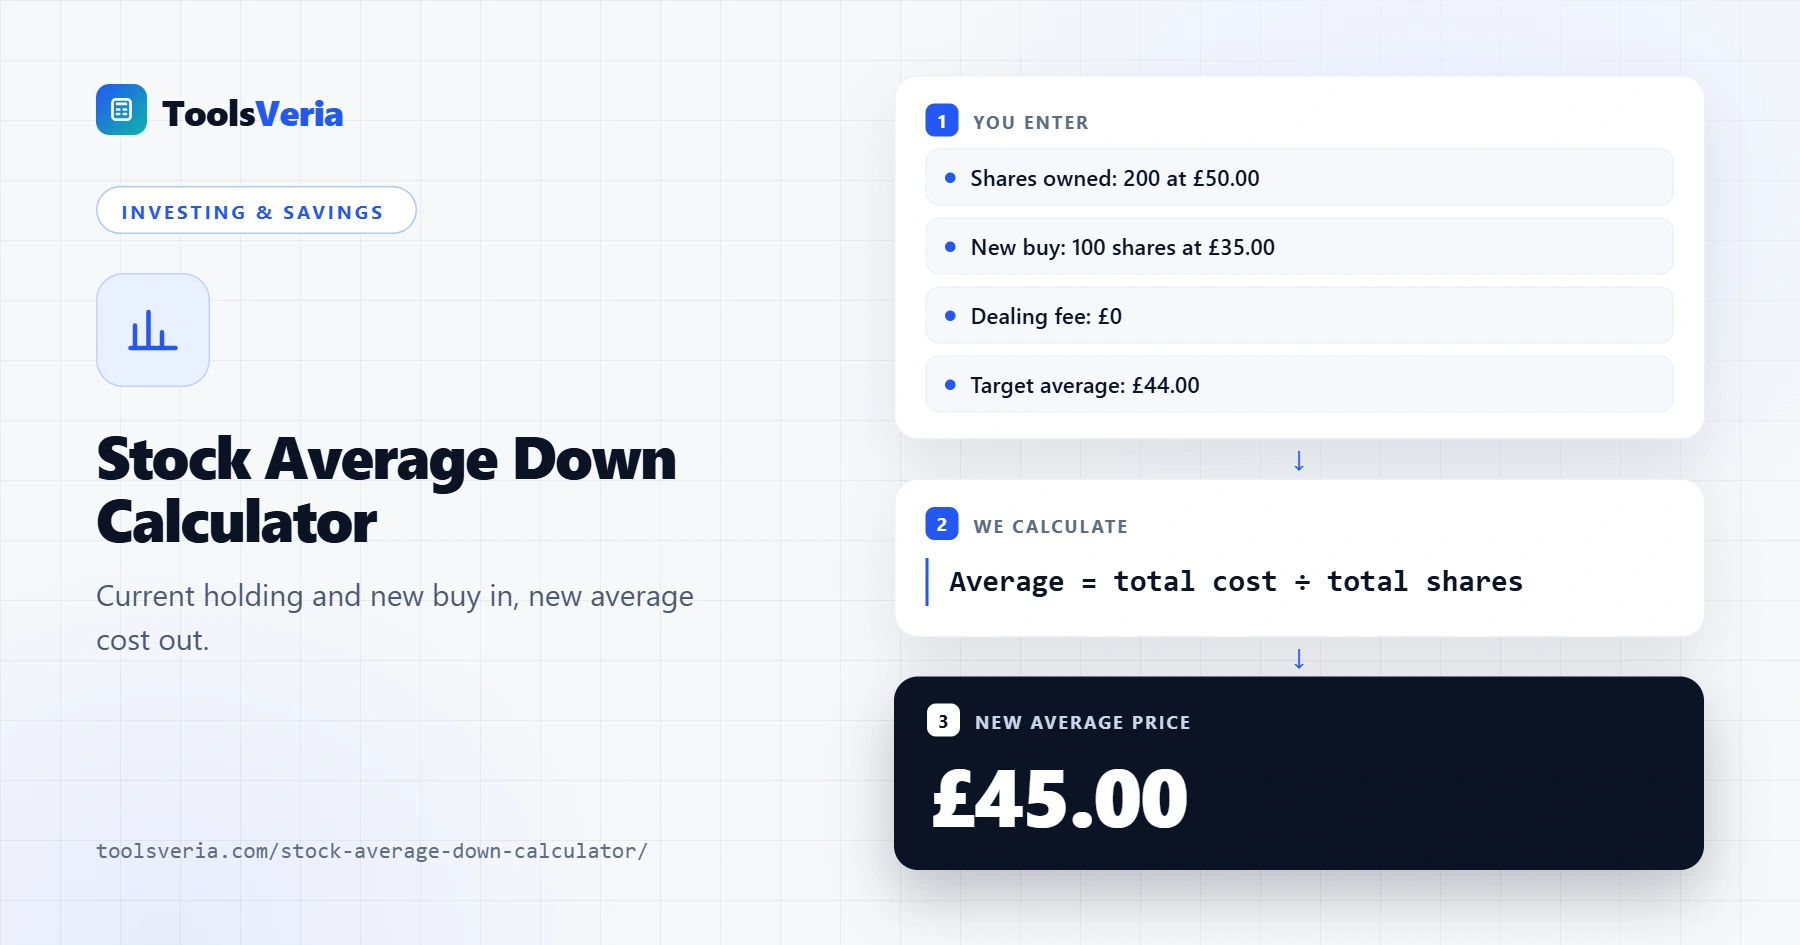
Quick answer: A stock average down calculator uses (old shares × old average + new shares × new price + fee) ÷ total shares. Buying 100 shares at £35 after 200 at £50 lowers the average to £45, so the rise needed to break even falls from 42.9% to 28.6%, though the £3,000 paper loss stays.
In This Guide
What Does Averaging Down Mean?
Your average price is everything you have paid for a holding divided by the number of shares you own. A fresh purchase below that figure drags it lower, which means a smaller recovery is needed before the position shows a profit. The calculation is (old shares × old average + new shares × new price + fee) ÷ total shares.
Here is a worked case. Tom bought 200 shares in a retailer at £50, spending £10,000. After a poor trading update they fall to £35. If he buys 100 more for £3,500, he owns 300 shares that cost £13,500 in total, so his average becomes £45. Before the top up the shares had to rise 42.9% to get him back to even; now a 28.6% rise does it. His paper loss is still £3,000 either way. Averaging down changes the break even point, not the loss already taken.
How to Use the Stock Average Down Calculator
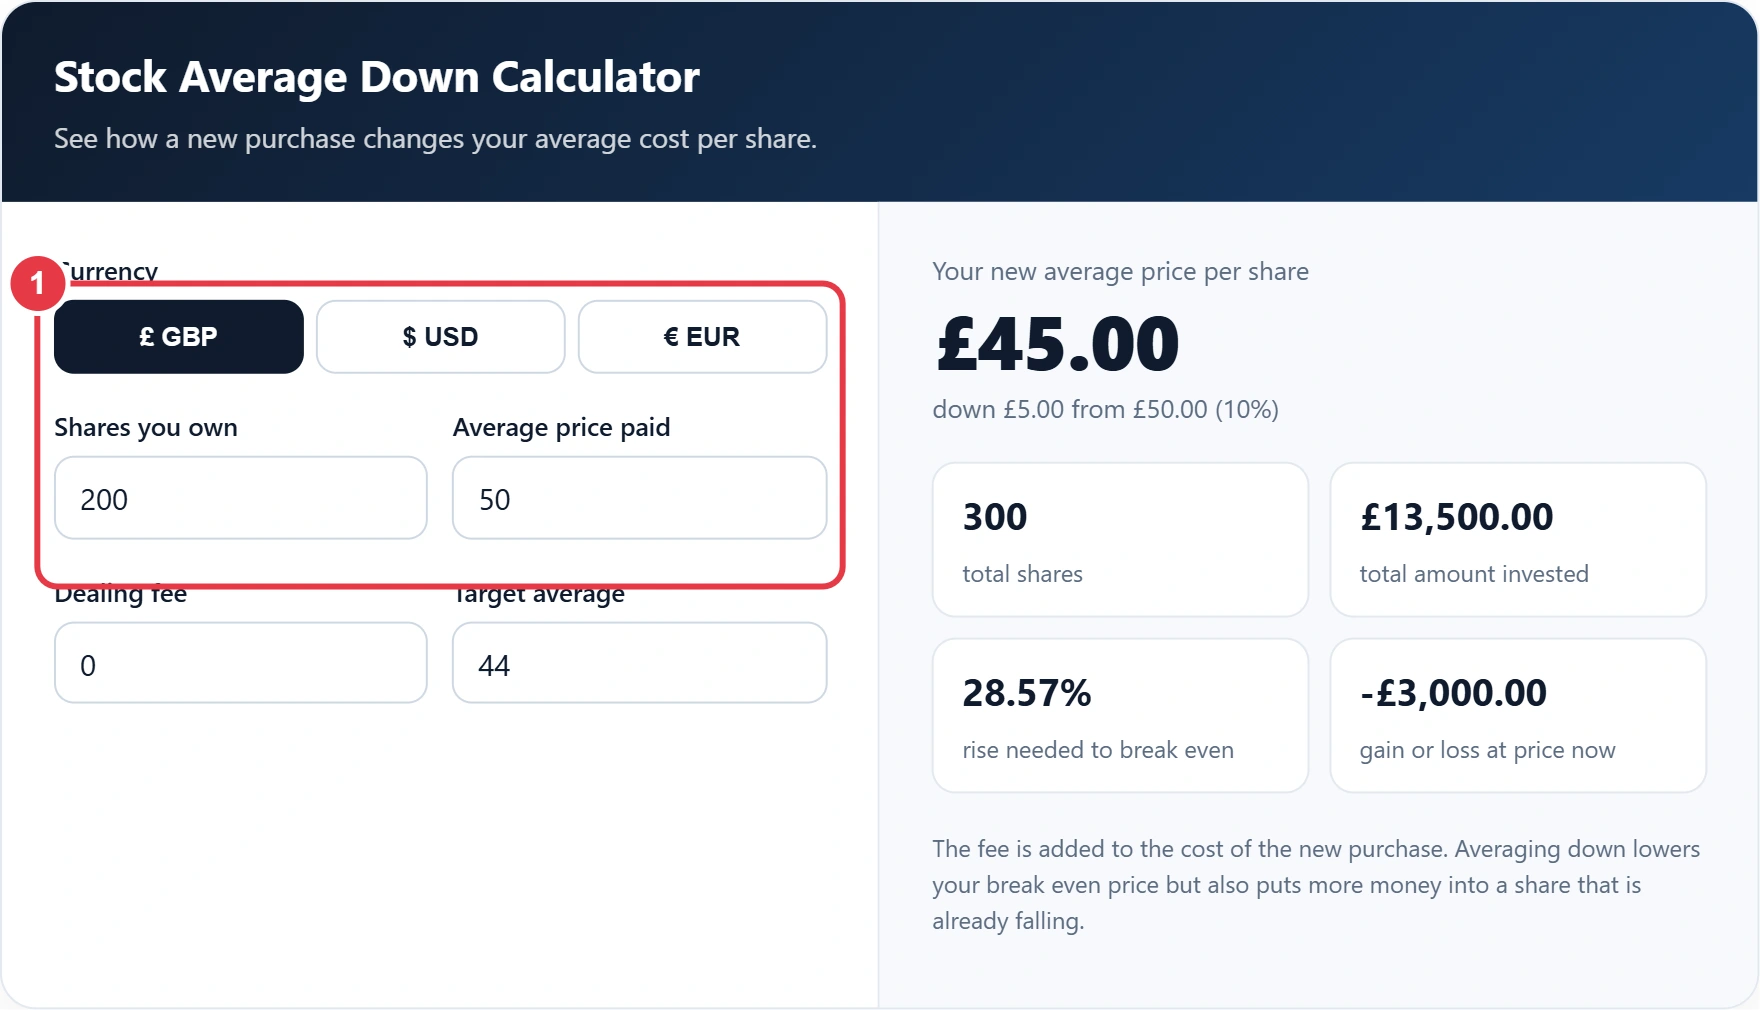
Step 1: Enter Your Current Holding
Pick a currency, then type how many shares you own and the average price you paid. Your broker usually shows this as "average cost" or "book cost per share" on the holding page.
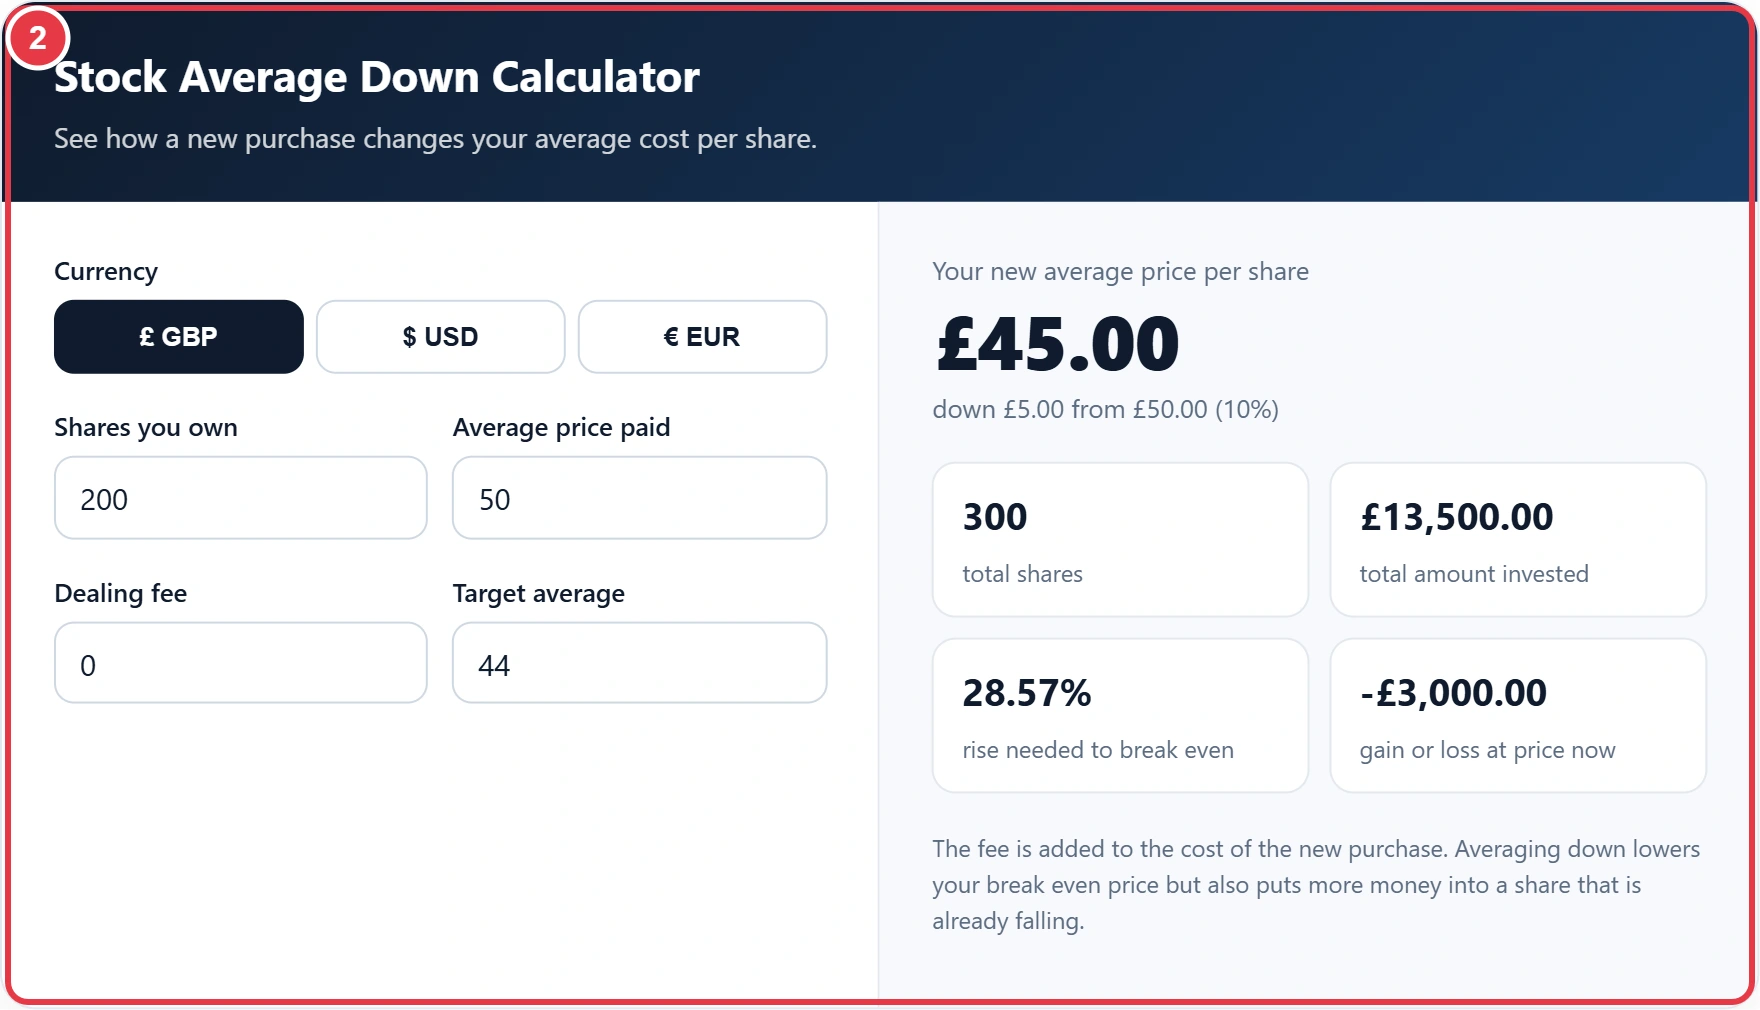
Step 2: Add the New Purchase
Enter the number of shares you are thinking of buying and today's price. Try a few quantities to see how quickly the benefit fades: each extra share moves the average a little less than the one before.
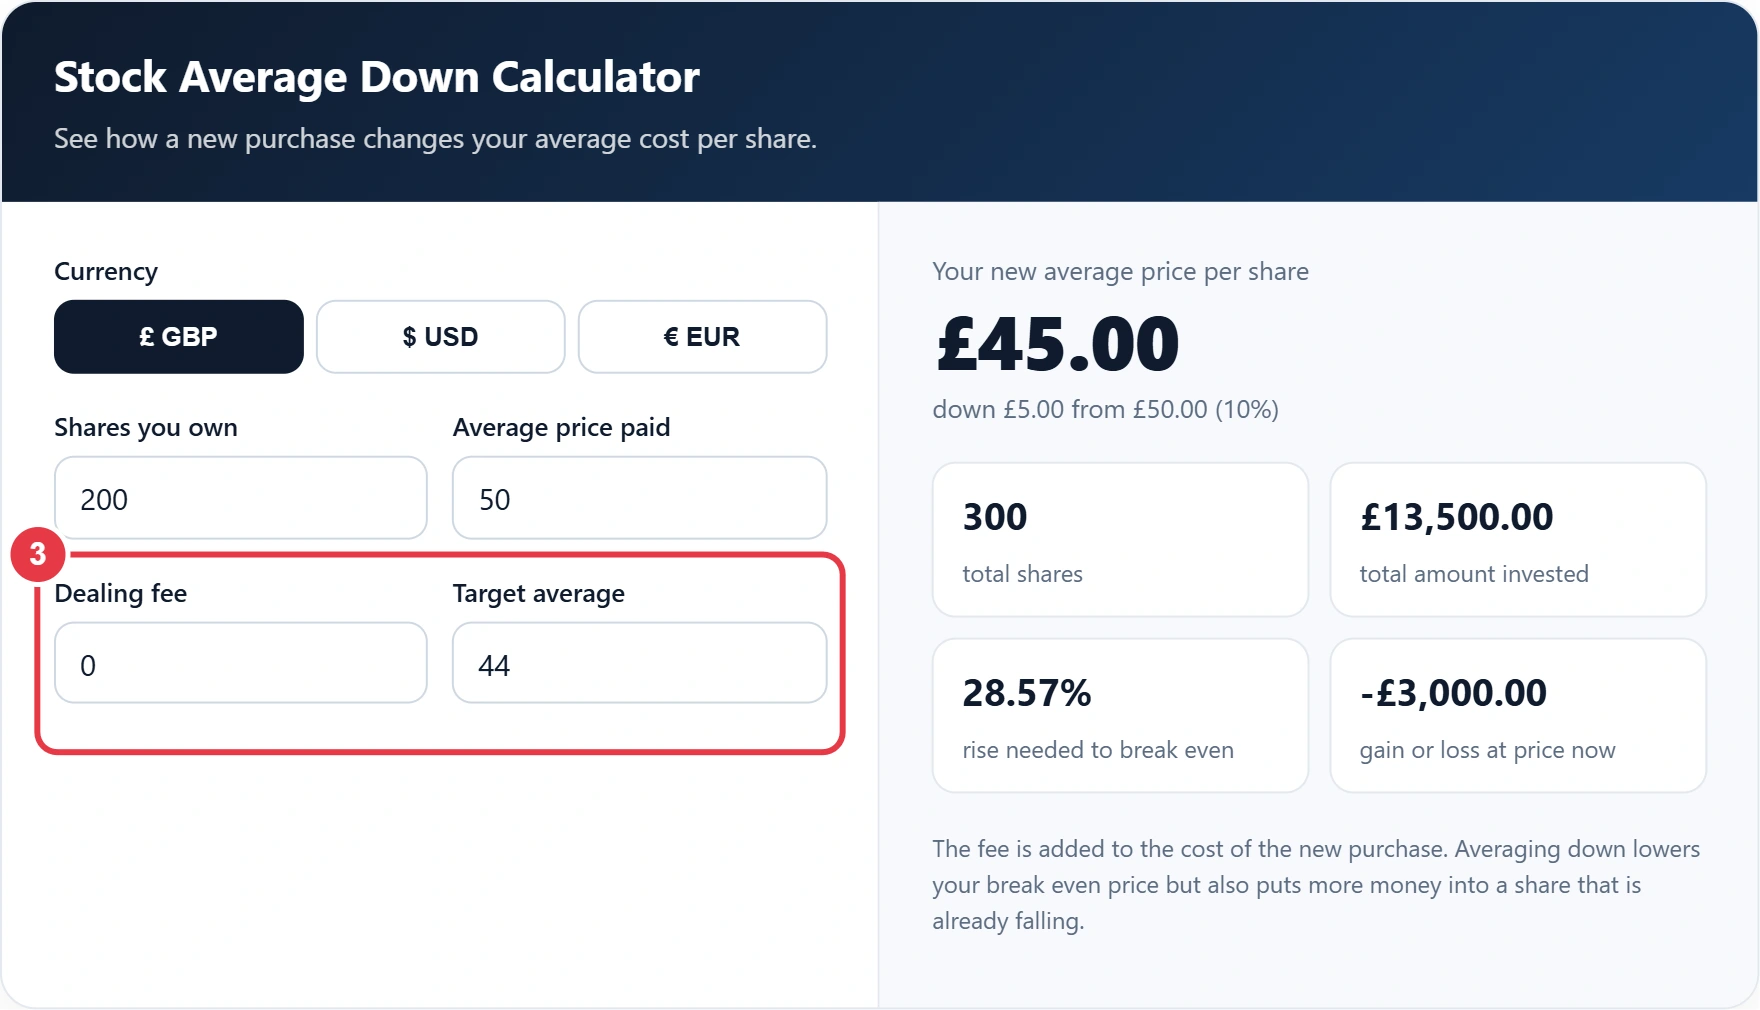
Step 3: Include Fees and a Target
Add your dealing fee so the average reflects the true cost of the trade. Then set a target average and the calculator works out how many shares you would need. To compare your old and new average as a straight percentage, the percentage difference calculator gives the gap between any two figures in one step.
Step 4: Read Your Results
You will see the new average, total shares, total invested, the rise needed to break even and your gain or loss at today's price. The box below the figures shows what reaching your target average would cost.
Before You Average Down
- Ask whether you would buy the share today if you did not already own it. If the answer is no, a lower average will not fix that.
- Check how much of your portfolio the holding will be after the top up. Doubling into one name raises your risk even if the average looks better.
- Keep a record of each purchase. HMRC normally pools shares of the same company into one average cost for Capital Gains Tax, which works much like this calculator.
If you eventually sell at a profit, the GOV.UK guide on tax when you sell shares explains when that gain becomes taxable, and the FCA InvestSmart pages cover diversification in plain terms.
If you would rather build a position steadily than react to a fall, the average calculator can help you track the mean price across a series of regular buys.
Stock Average Down Terms You Should Know
These definitions explain the cost basis and risk concepts behind the stock average down calculator so you can weigh a top up purchase realistically.
- Averaging down
- Buying more shares of a holding after its price has fallen, which lowers the average cost of the whole position. It reduces the recovery needed to break even but increases the amount exposed to that single company.
- Cost basis
- The total amount paid to acquire an investment, including dealing fees, used to work out gains or losses. Dividing it by the number of shares owned gives the average cost per share that brokers display.
- Break-even price
- The share price at which selling the entire holding would return exactly what was spent, ignoring any further costs. Averaging down moves it lower, although the loss already showing at current prices stays the same.
- Unrealised loss
- A fall in value on an investment that is still held, often called a paper loss. It only becomes a realised loss when the shares are sold, and buying more shares does not reduce its size.
- Dealing fee
- The charge a broker makes for executing a buy or sell order, either a flat amount per trade or a percentage of its value. Including it gives a truer average cost, especially on small purchases where a flat fee weighs heavily.
- Pound cost averaging
- A strategy of investing a fixed sum at regular intervals regardless of price, so more shares are bought when prices are low. Unlike averaging down, it follows a set schedule rather than reacting to one particular fall.
</>Embed this calculator on your website
Add the free Stock Average Down Calculator to your own site or blog. Copy the code below and paste it into an HTML block. It resizes itself and works on phones.
How we checked this tool: the Tools Veria Editorial Team built this tool by hand, checked it against the official rules or published standards where they apply, and tested it against worked examples. Results are estimates for planning, not personal financial or tax advice. Read our editorial policy and disclaimer, or report an error.
Frequently Asked Questions
How do I calculate my new average share price?
Add the total you paid for your existing shares to the cost of the new purchase, including fees. Divide that by the total number of shares you will own.
How many shares do I need to buy to reach a target average?
Multiply your current shares by the gap between your average and the target, then divide by the gap between the target and today's price. Round up to a whole share.
Does averaging down reduce my loss?
No. It lowers the price the share must return to for you to break even, but the loss already made on your first purchase stays the same.
Is averaging down the same as pound cost averaging?
Not quite. Pound cost averaging means investing a fixed amount on a schedule regardless of price, while averaging down means buying more only after a fall.
Should I include dealing fees in my average cost?
Yes. Fees are part of what you paid, and including them gives a more accurate break even price.
Can I use this for funds or crypto?
Yes. The maths is the same for any asset bought in units, such as fund units, ETFs or coins.