Test of independence or goodness of fit, with expected counts and every step shown.
Labels are optional: a first line of column names and a name at the start of each row are detected automatically. Paste straight from a spreadsheet.
| Cell | Observed | Expected | (O − E)²/E |
|---|
Use counts, not percentages. Expected counts should be 5 or more in at least 80% of cells and never below 1. Your data stays in your browser.
This chi-square test calculator tells students, researchers and survey analysts whether counts in categories differ from what chance would produce, using a test of independence for tables or a goodness of fit test for a single list. It applies Pearson's chi-squared test exactly, shows expected counts and gives an exact p value. Formulas checked October 2026.
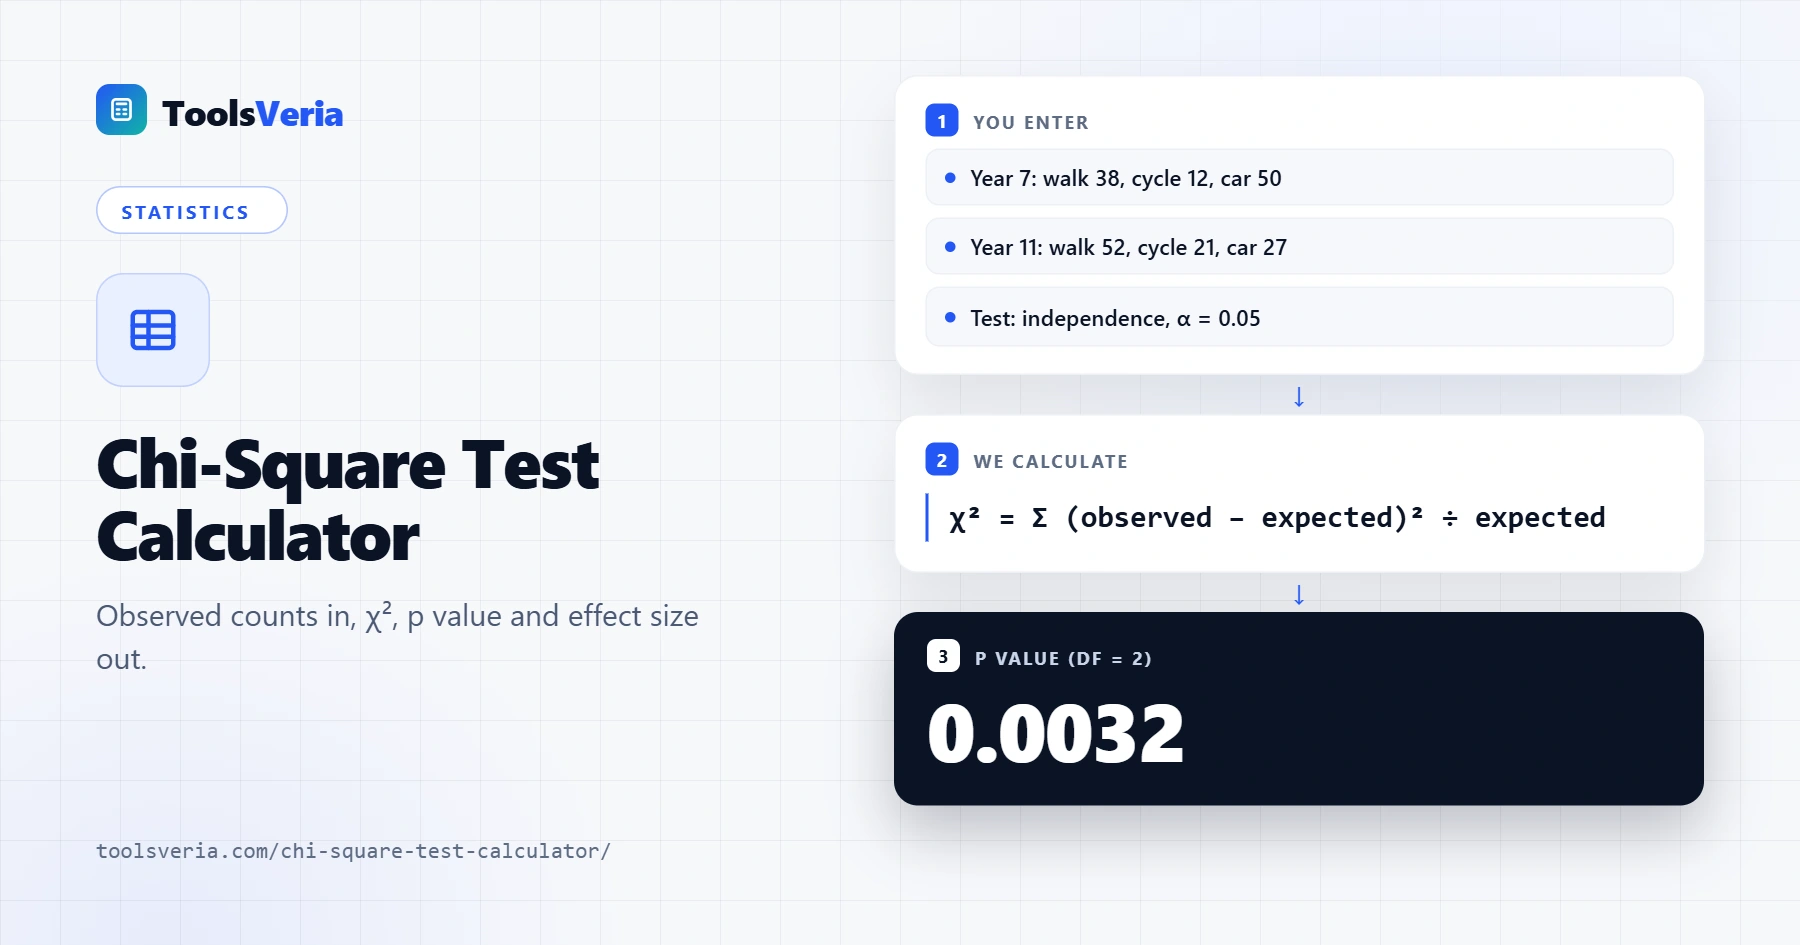
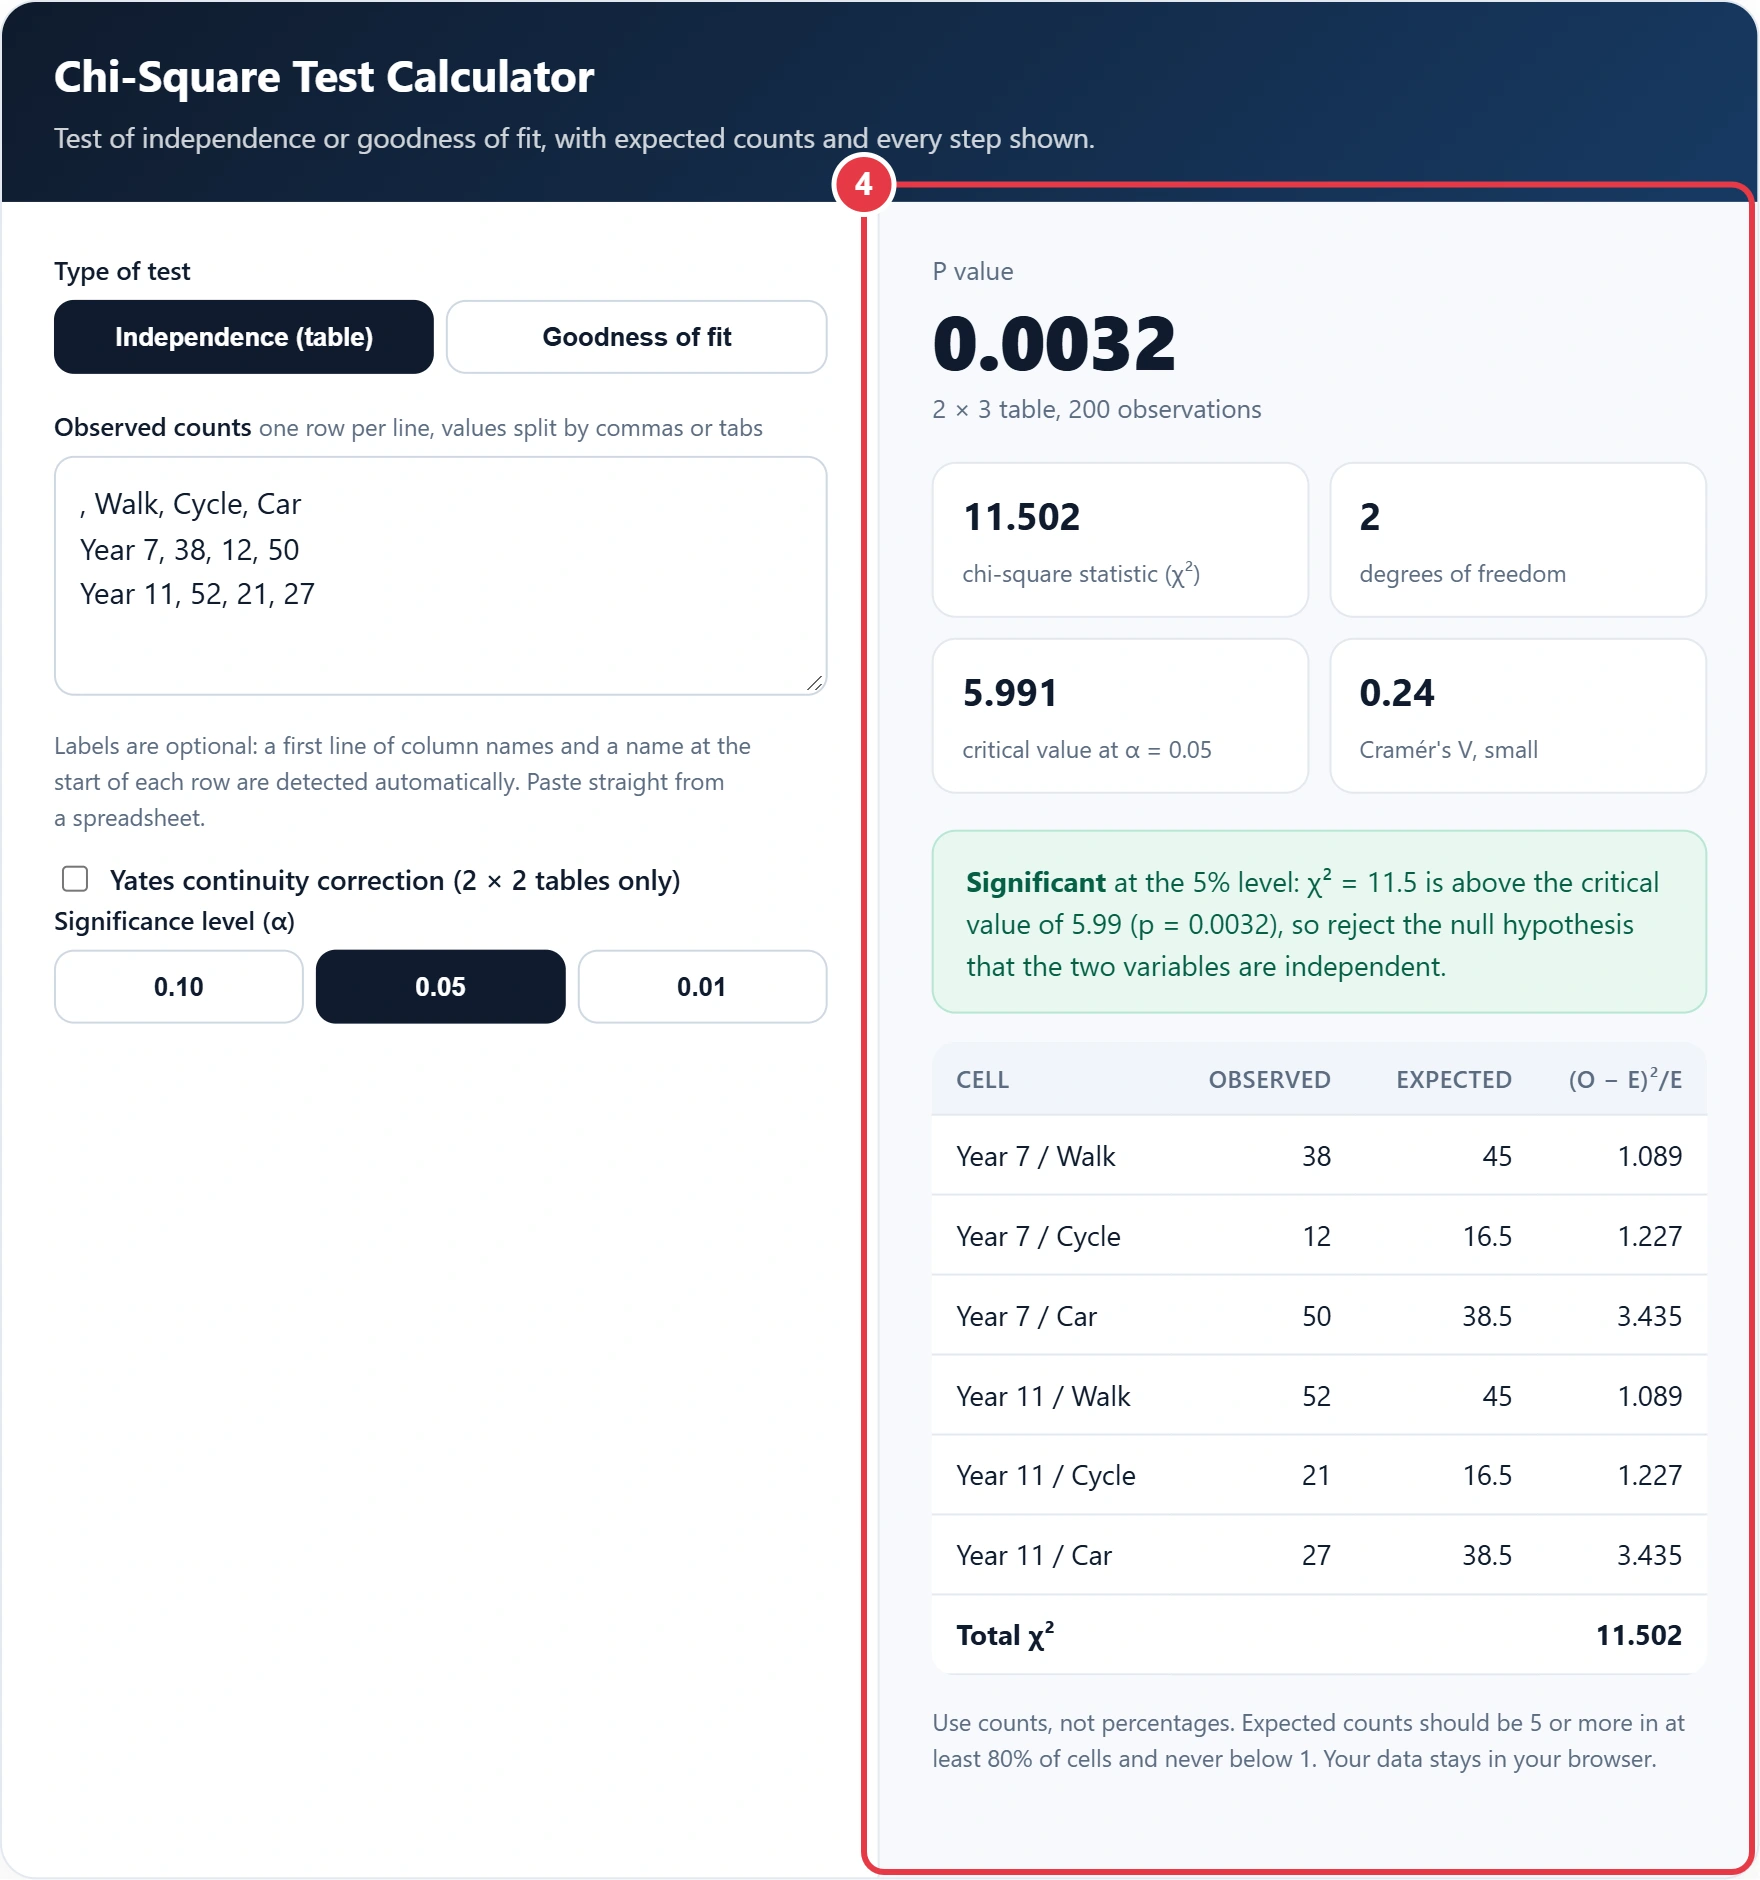
Quick answer: the chi-square statistic adds up (observed − expected)² ÷ expected across every cell. In the example loaded in this chi-square test calculator, 200 pupils' travel choices give χ² = 11.50 with 2 degrees of freedom and p = 0.0032, so travel mode and year group are linked at the 5% level.
In This Guide
What Is a Chi-Square Test?
A chi-square test is a hypothesis test for count data that measures how far observed frequencies sit from the frequencies expected under the null hypothesis. In words: for each cell, square the gap between observed and expected, divide by expected, then add the results. A large total means the data fit the null hypothesis badly.
The total is compared with a chi-square distribution on the right degrees of freedom. The calculator works out the upper tail area with the regularised incomplete gamma function, so the p value is exact rather than read from a printed table with only a few columns.
How to Use the Chi-Square Test Calculator
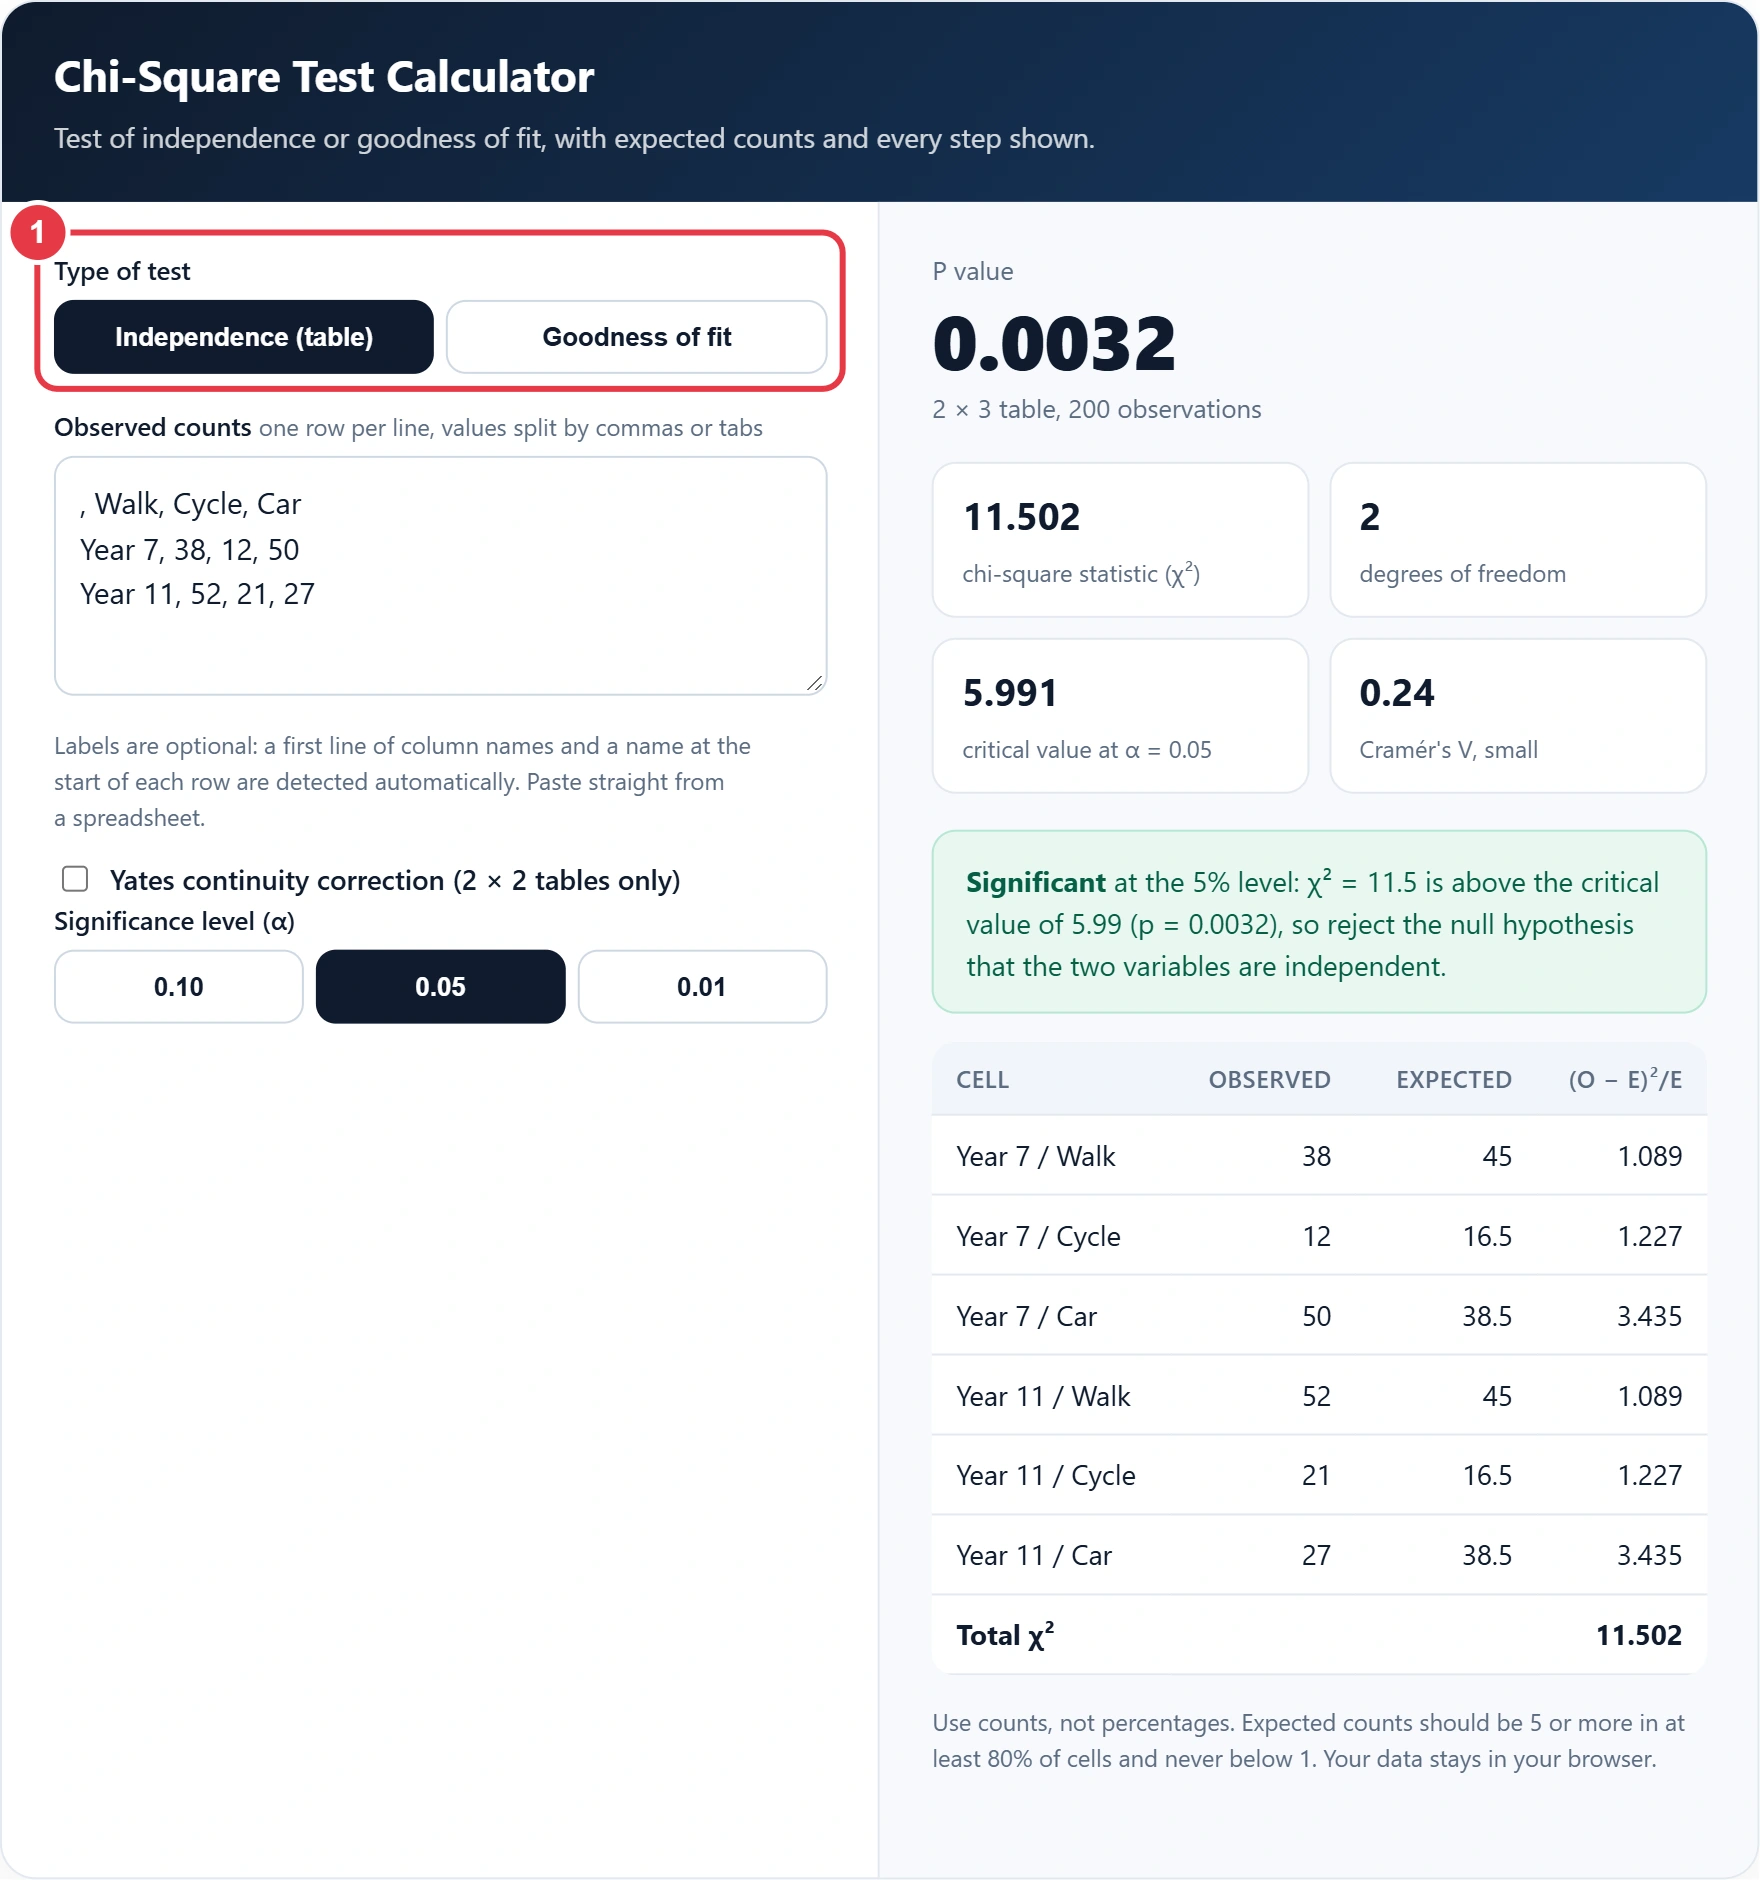
Step 1: Choose the Type of Test
Pick Independence when you have two categorical variables in a table, such as year group by travel mode. Pick Goodness of fit when you have one variable and a claimed distribution, such as a die that should land on each face equally often.
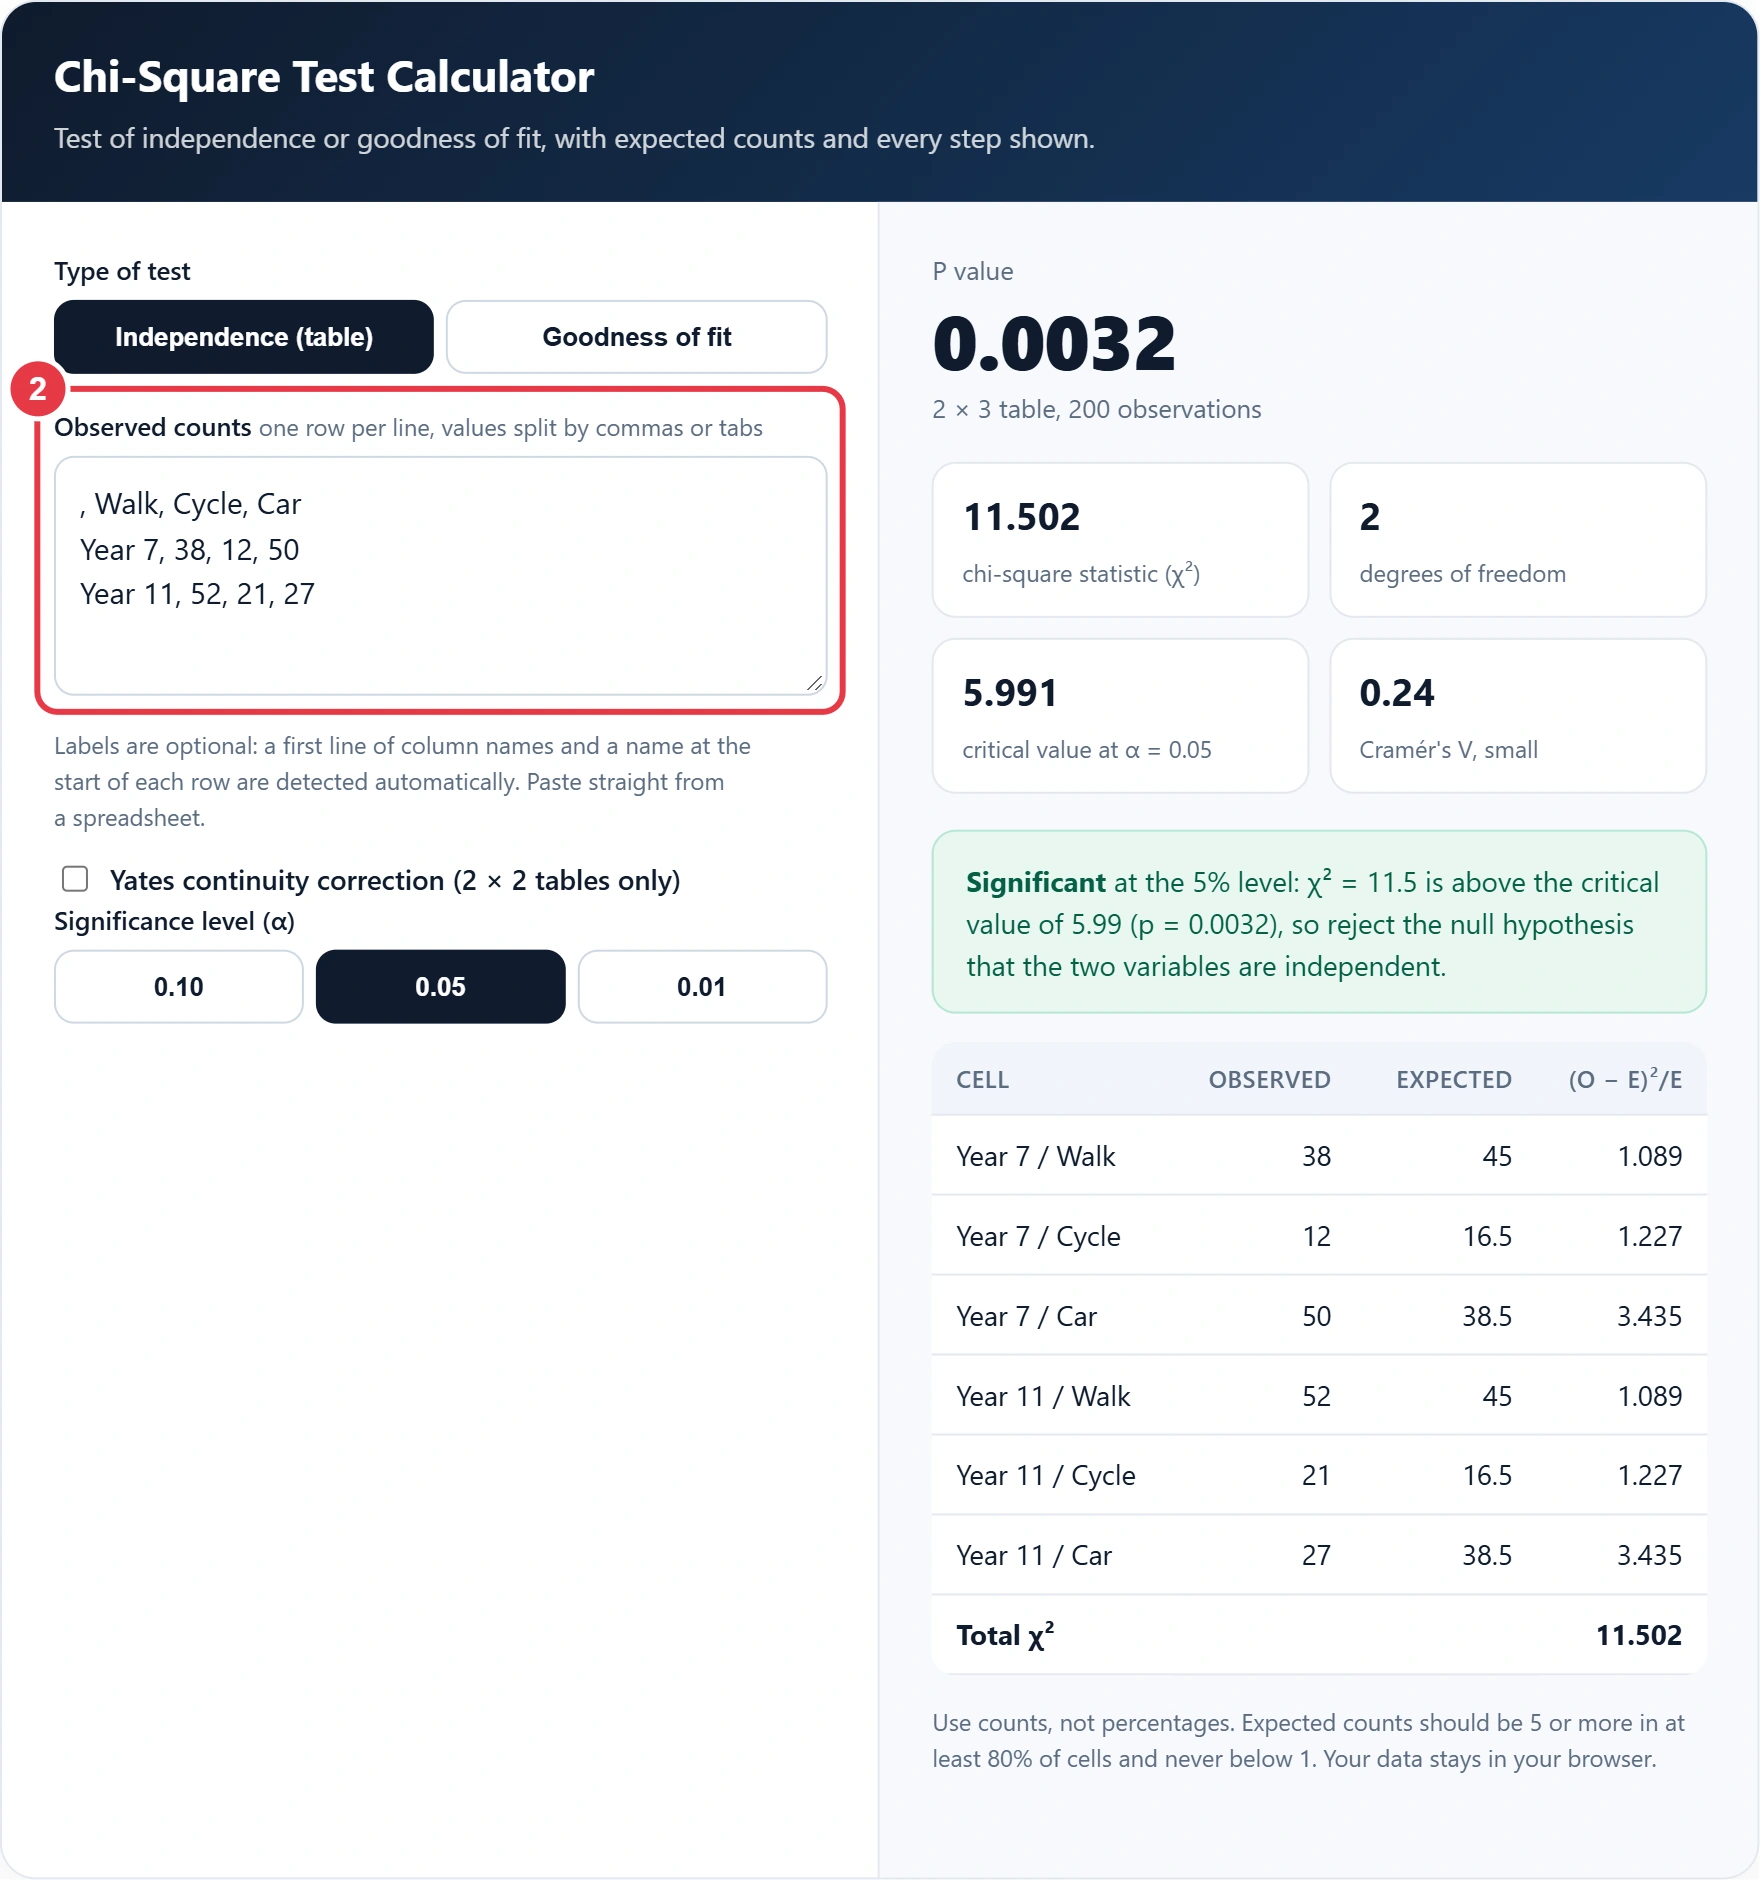
Step 2: Paste Your Observed Counts
Type or paste one row per line, with values separated by commas or tabs. Column names on the first line and a label at the start of each row are optional, and the chi-square test calculator detects them. For goodness of fit you can also enter custom expected shares such as 9, 3, 3, 1; the ratio calculator helps you simplify or scale a ratio like that before you paste it in.
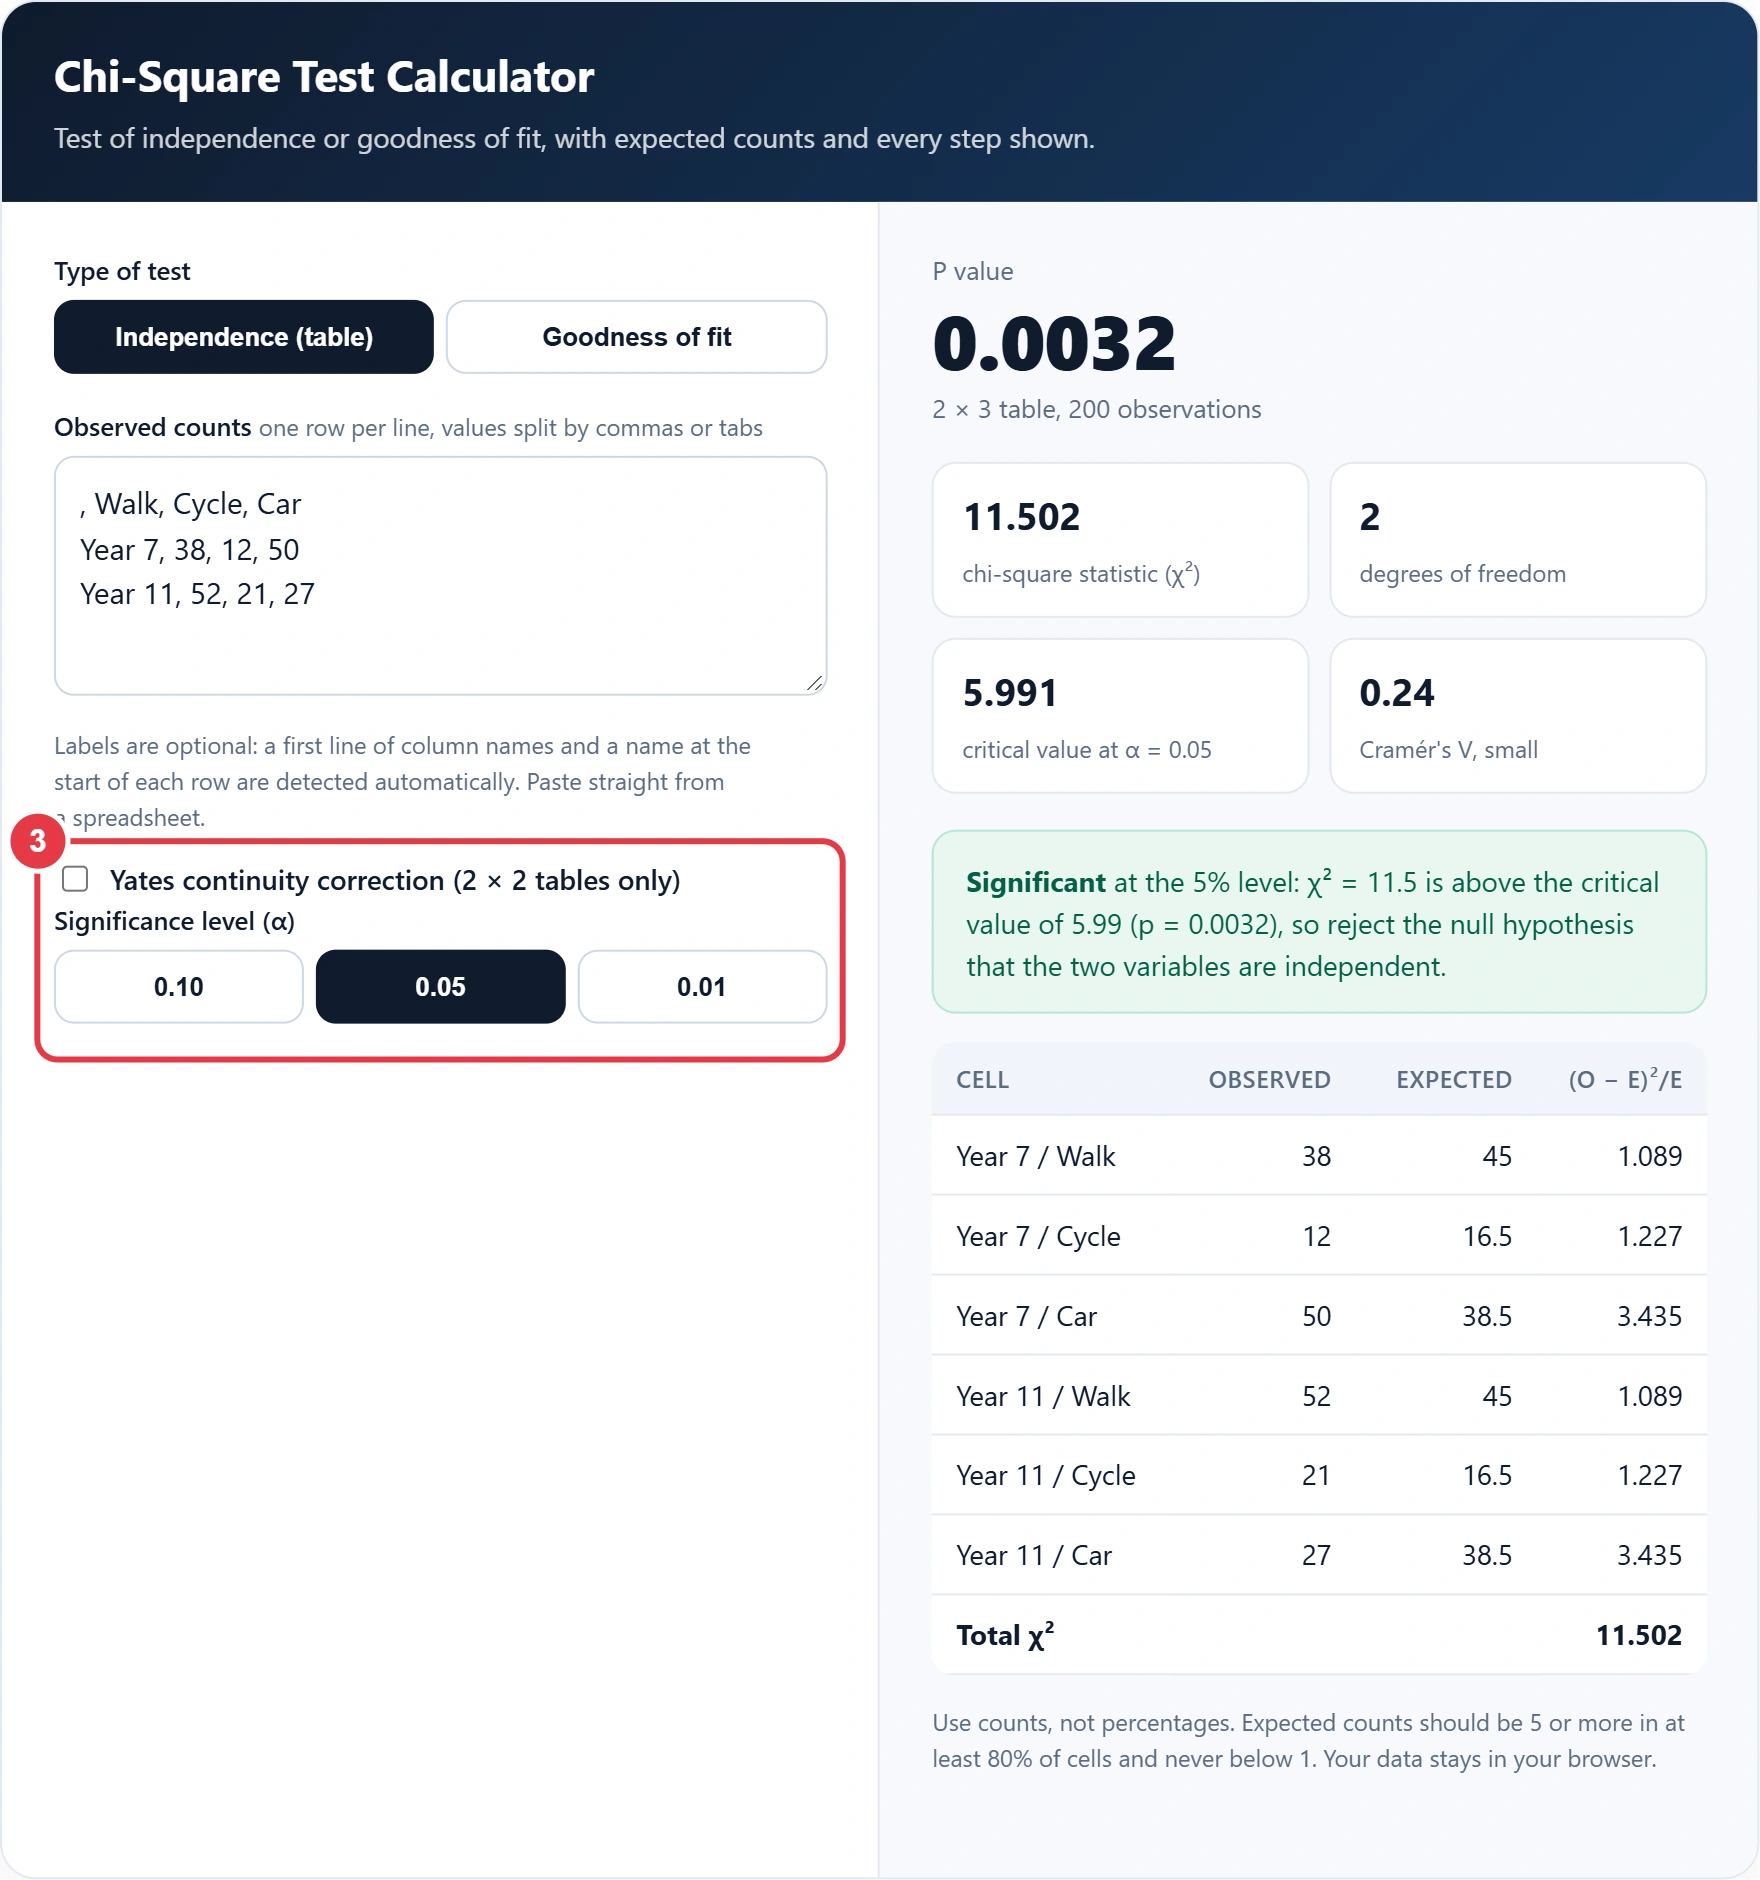
Step 3: Set Yates Correction and Alpha
Tick Yates continuity correction only for a 2 × 2 table when you want a more cautious result. Then choose a significance level; 0.05 is standard in most coursework and journals.
Step 4: Read the Result
The chi-square test calculator gives you the p value, χ², degrees of freedom, the critical value and an effect size. The table lists each cell's observed and expected count and its share of χ², so the biggest numbers in the last column show where the difference comes from.
Which Chi-Square Test Do I Need?
Use a test of independence for a two way table of counts and a goodness of fit test for one list of counts against expected proportions. Both use the same formula in the chi-square test calculator; only the expected counts and degrees of freedom change.
| Feature | Test of independence | Goodness of fit |
|---|---|---|
| Data | Two categorical variables in a table | One categorical variable |
| Null hypothesis | The variables are unrelated | Counts follow the stated proportions |
| Expected count | row total × column total ÷ grand total | total × expected proportion |
| Degrees of freedom | (rows − 1) × (columns − 1) | categories − 1 |
| Effect size | Cramér's V | Cohen's w |
How Do You Calculate a Chi-Square Test by Hand?
Work out each expected count, then add (O − E)² ÷ E across all cells and look up the p value for that total on (rows − 1) × (columns − 1) degrees of freedom. Here is the example loaded in the tool.
Owen, a geography teacher, surveys 100 Year 7 and 100 Year 11 pupils about how they get to school. Year 7: 38 walk, 12 cycle, 50 come by car. Year 11: 52 walk, 21 cycle, 27 by car. The walk column totals 90, so each expected walk count is 100 × 90 ÷ 200 = 45; cycling expects 16.5 and car 38.5 in each row.
| Cell | Observed | Expected | (O − E)² ÷ E |
|---|---|---|---|
| Year 7, walk | 38 | 45 | 1.089 |
| Year 7, cycle | 12 | 16.5 | 1.227 |
| Year 7, car | 50 | 38.5 | 3.435 |
| Year 11, walk | 52 | 45 | 1.089 |
| Year 11, cycle | 21 | 16.5 | 1.227 |
| Year 11, car | 27 | 38.5 | 3.435 |
| Total χ² | 200 | 200 | 11.502 |
With (2 − 1) × (3 − 1) = 2 degrees of freedom, the critical value at 0.05 is 5.991. Owen's χ² of 11.50 is well above it, and p = 0.0032. Cramér's V is 0.24, a small but real association, and the car cells contribute most: younger pupils are driven far more often.
What Does a Significant Chi-Square Result Mean?
A significant result, p below 0.05, means counts this far from expected would occur less than 5% of the time if the null hypothesis were true. It shows an association, not a cause, and it does not say how strong the link is; that is what Cramér's V or Cohen's w adds.
A non significant result is also informative. Switch to Goodness of fit and the loaded dice data (15, 22, 18, 27, 14 and 24 from 120 rolls) give χ² = 6.70 on 5 degrees of freedom and p = 0.244, so there is no evidence the die is biased. If your outcome is a conversion rate for two web pages, the A/B testing significance calculator runs the equivalent two proportion test and adds a sample size planner, which makes it the better choice for marketing experiments.
When Should You Use Yates' Correction?
Use Yates' correction only on 2 × 2 tables, mainly when expected counts are small, because it subtracts 0.5 from each |O − E| and makes the test more conservative. Take a clinic that sent appointment reminder texts: 30 of 50 patients who got a text attended, against 18 of 50 who did not. Without correction χ² = 5.77 and p = 0.0163; with Yates's correction χ² = 4.85 and p = 0.0277. Both are significant here, but near the 0.05 line the choice can change your conclusion, so report which one you used.
A chi-square test calculator works on counts, not means. If you measured something on a continuous scale, such as test scores or reaction times, the t-test calculator is the right tool for comparing two group averages, while this one handles categories.
Key Chi-Square Test Terms Explained
These definitions explain the statistics behind the chi-square test calculator, so you can read the p value, degrees of freedom and effect size correctly.
- Null hypothesis
- The default assumption a statistical test sets out to challenge, such as two categorical variables being unrelated or a die being fair. A small p value counts as evidence against it, not as proof that the alternative is true.
- Expected frequency
- The count each cell would hold if the null hypothesis were exactly true. In a contingency table it equals the row total multiplied by the column total, divided by the grand total of all observations.
- Degrees of freedom
- The number of values in a calculation that are free to vary once the totals are fixed. For a table it equals the number of rows minus one multiplied by the number of columns minus one.
- P value
- The probability of seeing a test statistic at least as extreme as the one observed if the null hypothesis held. Comparing it with the chosen significance level decides whether the result is reported as statistically significant.
- Contingency table
- A grid that cross tabulates counts for two categorical variables, with one variable in the rows and the other in the columns. It is the standard input for a chi-square test of independence.
- Cramér's V
- An effect size for chi-square tests that scales the statistic to a value between 0 and 1. It shows how strong an association is, which matters because very large samples can make tiny differences statistically significant.
</>Embed this calculator on your website
Add the free Chi-Square Test Calculator to your own site or blog. Copy the code below and paste it into an HTML block. It resizes itself and works on phones.
How we checked this tool: the Tools Veria Editorial Team built this tool by hand, checked it against the official rules or published standards where they apply, and tested it against worked examples. Results are estimates for planning, not personal financial or tax advice. Read our editorial policy and disclaimer, or report an error.
Frequently Asked Questions
What is a good p value for a chi-square test?
A p value below 0.05 is the usual threshold for a significant chi-square result. It means counts this far from expected would appear less than 5% of the time by chance. Use 0.01 for stricter work.
How do I find the degrees of freedom for a chi-square test?
For a test of independence, multiply (rows − 1) by (columns − 1), so a 2 × 3 table has 2 degrees of freedom. For goodness of fit, use the number of categories minus 1, so a six sided die has 5.
What if my expected counts are below 5?
The chi-square test becomes unreliable if more than 20% of expected counts are below 5 or any is below 1. Merge sparse categories where it makes sense, or use Fisher's exact test for a small 2 × 2 table.
Can I use percentages in a chi-square test?
No. The chi-square test needs raw counts, because the statistic depends on sample size. Converting 38 out of 100 pupils into 38% loses that information, so always enter the original frequencies.
What is Cramér's V in a chi-square test?
Cramér's V measures the strength of association in a contingency table on a scale from 0 to 1. For a 2 × 2 or 2 × 3 table, about 0.1 is small, 0.3 medium and 0.5 large.
What is the difference between chi-square independence and goodness of fit?
A test of independence checks whether two categorical variables in a table are related. A goodness of fit test checks whether one variable's counts match expected proportions, such as equal shares for a fair die.